
 In 2012, we either re-elect a Democrat or newly elect a Republican—history shows either can be a sweet spot for stocks. Stocks have averaged 14.5% historically in election years a Democrat is re-elected and 18.8% when a Republican is newly elected.
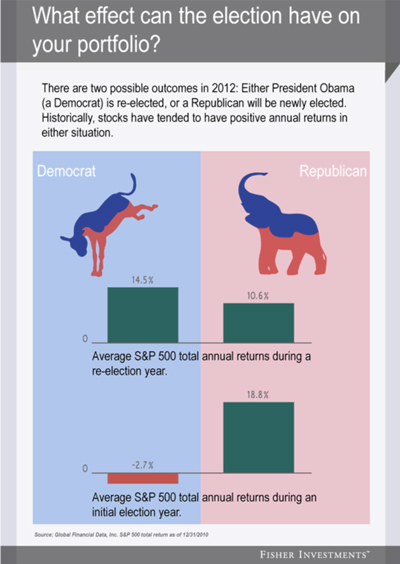 Source: Global Financial Data, Inc. S&P total return as of 12/31/10
When looking at the above returns, it may be hard to believe that we could end up with those kinds of returns by the end of the year … especially with the strong pullback we have seen recently. In light of this recent pullback in the markets, both domestically and internationally, it is important to revisit a chart we have shared before. It serves as an important reminder of the volatility experienced each year and the returns that investors end up having the potential to earn despite these pullbacks.

Of course you have no control over the market’s ups and downs or who gets elected, aside from your vote, to serve as the President of the United States, but you can be better prepared to weather these volatile cycles if you focus on factors you can control like staying fully invested.
The S&P 500 is an unmanaged index of 500 widely held stocks that are generally considered representative of the U.S. stock market. Inclusion of this index is for illustrative purposes only. Keep in mind that individuals cannot invest directly in any index, and individual investor’s results will vary. Past performance does not guarantee future results. The information contained in this report does not purport to be a complete description of the securities, markets, or developments referred to in this material. Any information is not a complete summary or statement of all available data necessary for making an investment decision and does not constitute a recommendation. Any opinions are those of Center for Financial Planning, Inc., and not necessarily those of RJFS or Raymond James.