Center Investing

The Shortened Trade Settlement Cycle

Mallory Hunt Contributed by: Mallory Hunt

Print Friendly and PDF

In the ever-evolving landscape of financial markets, efficiency is the name of the game. Every advancement that streamlines processes not only saves time and resources but also enhances market dynamics. One significant recent development is the shortened trade settlement cycle.

In the past, trade settlements took several days to complete, which meant longer periods of time until you could access your money. On May 28th, 2024, the U.S. Securities and Exchange Commission (SEC) is shortening the settlement cycle from the current two business days (Trade date + 2 or T+2) to one business day (T+1) for most securities transactions, including but not limited to trades for stocks, corporate and municipal bonds, mutual funds, and unit investment trusts (UITs).  

What does this mean for you, and why does it matter? At its core, a shortened settlement cycle reduces the time it takes for a trade to be finalized, allowing you to receive faster payment following the sale of a security. Keep in mind that this also means you will be required to provide funds more promptly following the purchase of a security or interest, which will begin accruing after the settlement date if the debit has yet to be covered. 

While the benefits of shortened settlement cycles are clear, the implementation is not without challenges. Market infrastructure, including trading platforms, clearing and settlement systems, and regulatory frameworks, must adapt to support faster settlement processes effectively by investing in technology and operational enhancements. Coordination between exchanges, clearinghouses, custodians, and regulators is essential to ensure a seamless transition in these processes and compliance with new requirements.

Nevertheless, the benefits of a shorter settlement cycle far outweigh the challenges and are a testament to the industry's ongoing commitment to efficiency and innovation. By streamlining the process of buying and selling securities, market participants can enjoy greater confidence, increased liquidity, and enhanced operational efficiency. You can find more information about this industry-wide change here. As with anything, if you have any questions on this upcoming change, please do not hesitate to reach out to us!

Mallory Hunt is a Portfolio Administrator at Center for Financial Planning, Inc.® She holds her Series 7, 63 and 65 Securities Licenses along with her Life, Accident & Health and Variable Annuities licenses.

The information has been obtained from sources considered to be reliable, but we do not guarantee that the foregoing material is accurate or complete. Any opinions are those of Mallory Hunt and not necessarily those of Raymond James.

Securities offered through Raymond James Financial Services, Inc., member FINRA/SIPC. Investment advisory services are offered through Center for Financial Planning, Inc. Center for Financial Planning, Inc. is not a registered broker/dealer and is independent of Raymond James Financial Services.

Should I Invest When Markets Are Making New Highs?

Print Friendly and PDF

While it may seem counterintuitive, the answer can be yes! The chart below shows forward returns for the S&P500 when investing on days when the market is making new highs. The green bar shows the average forward returns when investing on a day the market makes a new high, and the gray bar shows the forward returns on average when investing on any day. You might be surprised to learn that the outcome is usually better when investing when markets are making new highs!

Think about timing the market less and focusing more on your short- and long-term financial goals. Deciding when and how to invest is more nuanced and needs to be tailored to your situation rather than focusing on short-term market fluctuations. If you are uncertain about the best course of action, ask your financial planner!

Angela Palacios, CFP®, AIF®, is a partner and Director of Investments at Center for Financial Planning, Inc.® She chairs The Center Investment Committee and pens a quarterly Investment Commentary.

Securities offered through Raymond James Financial Services, Inc., member FINRA/SIPC. Investment advisory services are offered through Raymond James Financial Services Advisors, Inc.

Center for Financial Planning, Inc. is not a registered broker/dealer and is independent of Raymond James Financial Services.

The foregoing information has been obtained from sources considered to be reliable, but we do not guarantee that it is accurate or complete, it is not a statement of all available data necessary for making an investment decision, and it does not constitute a recommendation. Any opinions are those of the author, and not necessarily those of Raymond James. Investing involves risk and you may incur a profit or loss regardless of strategy selected, including diversification and asset allocation. Keep in mind that individuals cannot invest directly in any index, and index performance does not include transaction costs or other fees, which will affect actual investment performance. Individual investor's results will vary. The S&P 500 is an unmanaged index of 500 widely held stocks that is generally considered representative of the U.S. stock market.

Five Reasons Supporting the Case for Discretionary Investing

Mallory Hunt Contributed by: Mallory Hunt

Print Friendly and PDF

We all lead busy lives. Whether you are getting down to business (in the throes of the grind??) or enjoying your retirement to the fullest, who wants to worry about missing a call from their advisor because something in their portfolio needs to be changed? Perhaps cash needs to be raised to meet that monthly withdrawal to your checking account so you can keep paying your traveling expenses. Or maybe you are still in the saving phase, and money has to be deposited into your investment account to keep pace with your retirement goals. Regardless of your situation, many investors find it challenging to make time to manage their investment portfolios. We would argue that this is far too important to be left for a moment when you happen to have some “spare time” (is that a thing?!). In the dynamic world of finance, making the right investment decisions can be a complex and intimidating task. Discretionary investing emerges as a powerful solution for clients seeking an investment strategy that places the decision-making responsibilities in the hands of seasoned professionals, offering a myriad of benefits that cater to the diverse needs of investors.

What is Discretionary Management?

Discretionary management is the process of delegating day-to-day investment decisions to your financial planner. Establishing an Investment Policy Statement that identifies the guidelines you need your portfolio managed within is the first and arguably the most important step of the process. Investment decisions can then be made on your behalf within the scope of your unique criteria laid out in this statement. Think of it as utilizing a target date strategy in your employer’s 401(k): you tell it how old you are and when you will retire, and Voilà! All of the asset allocation, rebalancing, and buy/sell decisions are made for you.

5 Reasons This Can Be a Suitable Option for Investors:

  1. Adaptability to Market Changes: Financial markets are inherently unpredictable, and staying ahead of the curve requires constant vigilance. Discretionary management allows for swift responses to market changes, adjusting and rebalancing portfolios in real-time to capitalize on emerging opportunities or shielding against potential downturns. In the face of evolving market conditions, this adaptability ensures that your investments remain aligned with your financial goals, whether you can be reached or not.

  2. Time Efficiency: For many clients, the demands of daily life leave little time for in-depth market research and portfolio management. Discretionary investing provides a welcome solution by freeing clients from the burden of day-to-day decision-making. This frees up your time and allows your focus to be redirected to what’s important to you: your family, your career, and personal pursuits. After all, time is the resource we all struggle to get our hands on. Need I say more?

  3. Tailored Approach to Unique Goals: Discretionary investing is NOT a one-size-fits-all strategy. Seasoned investment managers take the time to understand each client’s unique financial goals, risk tolerance, and time horizon. This personalized approach ensures that investment strategies are aligned with the needs outlined in the Investment Policy Statement. Think of this as your customized roadmap to financial success. While this is similar to non-discretionary investing, discretion will allow investment managers the ability to keep your portfolio at this set target in a timely manner through strategic and tactical rebalancing when the markets are changing.

  4. Diversification & Risk Management: Successful investing is not solely about maximizing returns but also about minimizing risks. Discretionary management employs strategies to diversify portfolios and manage risk effectively. By expanding investments across various asset classes and geographical regions, we can create a resilient portfolio that can weather market fluctuations and aims to deliver more consistent returns over the long term. Again, while this can also be applicable to non-discretionary management, it comes down to the time efficiency offered by discretionary management to continuously monitor your diversification and risk management with no bother to you.

  5. Expert Guidance: Discretionary investing allows clients to tap into the expertise of financial professionals; it’s what we are here for! Financial planners and investment managers bring a wealth of knowledge and experience to the table, navigating the intricacies of the market to make informed decisions on your behalf, with your best interest in mind always. In turn, leaving the decision-making to the professionals may reduce the potential for poor investor behavior. Let those not emotionally charged by fluctuations in the market make decisions on your behalf.

In the fast-paced world of finance, where information overload and market volatility can overwhelm even the most seasoned investors, discretionary investing presents itself as a compelling choice. By entrusting investment decisions to experienced professionals, clients may enjoy soundness, time efficiency, and a tailored approach that empowers their financial future. If you have questions on whether discretionary management suits you and your portfolio, don’t hesitate to contact us. We’d be happy to help you weigh out your options!

Mallory Hunt is a Portfolio Administrator at Center for Financial Planning, Inc.® She holds her Series 7, 63 and 65 Securities Licenses along with her Life, Accident & Health and Variable Annuities licenses.

Keep in mind that discretion may not be appropriate for clients who prefer to participate in investment decisions or maintain concentrated positions. Additionally, discretionary authority may not be possible with certain investing strategies or accounts, such as options or annuities. Another consideration is whether an advisory account is the best option for client or if a brokerage account would be more suitable. Its important to consider all options and speak with a financial advisor about your specific situation.

The information contained in this blog does not purport to be a complete description of the securities, markets, or developments referred to in this material. The information has been obtained from sources considered to be reliable, but we do not guarantee that the foregoing material is accurate or complete. Any opinions are those of Mallory Hunt and not necessarily those of Raymond James. There is no guarantee that these statements, opinions or forecasts provided herein will prove to be correct. Investing involves risk and you may incur a profit or loss regardless of strategy selected. Every investor's situation is unique and you should consider your investment goals, risk tolerance and time horizon before making any investment. Prior to making an investment decision, please consult with your financial advisor about your individual situation.

Q3 2023 Investment Commentary

Print Friendly and PDF

The third quarter of the year has brought some downside volatility with it. While it can be concerning when opening your statement, it is important to remember that minor pullbacks are very normal throughout the year. August and September are, historically, the toughest months on average for markets, as shown by the chart below. The good news is that the last quarter of the year tends to be one of the strongest on average.

Over the past quarter, investor mood has shifted. The S&P 500 ended the quarter down 2.08%. A diversified portfolio ended the quarter down 2.63% if using a simple blended benchmark of (40% Barcap Aggregate Bond index, 40% S&P 500, and 20% MSCI EAFE International index). Quarters like this make it challenging to remember why you want to continue holding a diversified portfolio. Periods like that of 2000-2008 are a distant memory for most investors (and many have never experienced investing when U.S. markets and technology companies have struggled). If you dissect the returns of the S&P 500 year to date, you can see that most of the returns have come from the media dubbed “Magnificent Seven.” In reality, the remaining 493 companies in the S&P have contributed only about 2% of the positive 13% in year-to-date returns. The chart below shows how just these seven companies are responsible for most of the returns.

Source: Morningstar Direct

Maintaining a balanced approach to investing is important, as most of us are investing over a lifetime. While diversification may not always work over short periods of time, studies show it to be a successful strategy over the long term.

What contributed to volatility this quarter?

Higher intermediate and long-term interest rates have spelled trouble for equity valuations recently. The Federal Reserve (the Fed) did not raise rates in September but signaled that they are likely to raise one more time this year and are unlikely to cut rates in early 2024. This has caused longer-term bond rates to increase drastically over the summer (about 1%). We have continued to maintain our allocation to short-duration bonds, which has helped over that time period.

Higher interest rates contribute to equity volatility because investors view all asset classes through a risk/reward lens when determining where best to deploy money. When interest rates are low, investors are incentivized to reach for yield in equities as they pay an attractive dividend (more than treasury bonds were paying for a long time!). You also have the added upside potential of capital appreciation. When you can get interest above 5% in a money market or CD with extremely low risk, investors are less incentivized to invest money into equities, as most of the return needed to achieve long-term goals can be earned with little to no risk! Rates usually don’t stay elevated like this for very long. On average, the period between the last interest rate increase by the Fed and the first interest rate cut is nine months in historically similar periods. So don’t expect these high rates with no risk to stay around long.

Political brinksmanship is yet again holding the economy hostage to further both sides’ political agendas. The government averted a shutdown with only hours left but kicked the can down the road, so we may hear about this again in November. Like with the debt ceiling, we have been here before. The good news is, generally, shutdowns don’t coincide with recessions. There is a lot of noise and, usually, short-term volatility but not a longer-term impact on markets or the economy. The longest shutdown was 35 days at the end of 2018. While it created some temporary market fluctuation, it did not cause a larger economic issue. At that time, the economy contracted about .2% that quarter but got that back the following quarter because government employees get back pay once things open back up. Moody’s, the final of the big three debt ratings agencies to have the U.S. rated AAA, is questioning their AAA rating on U.S. government debt because of the behavior of the politicians. 

Economic Growth is slowing

While Taylor Swift’s Eras Tour is coming to a close and noticeably adding to the local GDP of the cities she performs in, the rest of the economy might be better described by her song “Death By A Thousand Cuts.”

The consumer is out of extra money (one can only buy so many $90 concert t-shirts). The chart below shows how families had stockpiled excess earnings and government transfer payments from the COVID shutdown but have spent this excess savings over the past two years.

The UAW strike will continue to impact numbers like the above chart. As the strike expands, so does the risk of increased shutdowns and layoffs spread throughout the economy. It remains to be seen how long the strike will continue and, thus, how much of a negative impact on GDP it will have. While this strike will have economic consequences, it is only one industry. While there could be spillover if it goes on long enough (for example, people may go out to eat less if they are on strike and not earning their full wages), the UAW strike shouldn’t single-handedly be the cause of a recession.

Home affordability will continue to be hurt by high-interest rates.

Student loan payments restart in October, pulling more money out of the consumer’s pocket.   

Jobs are strong, but job openings are pulling back.

These items, or something yet unknown, could be the tipping point for the economy to turn over into recession in early 2024. Most don’t realize we have already been in an earnings recession this year. This is classified as two or more quarters of contraction in earnings from the prior year. S&P 500 companies have experienced this as a whole this year. Equity markets are certainly spooked about this and are reacting accordingly now, even as the Fed tries to engineer a “soft landing.”

What is a soft landing?

In short, very rare. Ideally, the Fed will stifle GDP growth enough with higher rates to bring down inflation but not stifle so much that growth turns negative. Rather, it just slows down, avoiding a recession. They are counting on the strength of the labor market to remain, keeping the economy out of recession. Only time will tell if the Fed will need to keep rates higher for longer to put the inflation genie back in the bottle. They have come a long way in fighting inflation, as it was just a year ago that we were talking about 9% inflation, and now we are below 4%. The easy sources of inflation have been targeted and curbed (think supply chain shortages), so now it is time to let high interest rates work their magic throughout the economy.

Politics

The Speaker of the House, Kevin McCarthy, was ousted in a 216-210 vote, with 8 Republicans joining the unified Democratic vote. Patrick McHenry is serving as the temporary speaker, who is well respected in the house and should provide good leadership for now. Since we are well into the congressional term, proceeding without a formal leader shouldn’t be too disruptive to normal functioning as committees have already been formed and a rules process adopted. Electing a new speaker will, however, take valuable time away from working on funding the government past the November 17th deadline.

The media coverage is starting to pick up for the election in 2024. Undoubtedly, headlines will only pick up later this year and throughout next year. While there is no shortage of negative headlines during an election year, they tend to be positive for markets. Markets don’t care which party controls the white house. I think many view Republicans as being more pro-business and assume that returns will be far better than when a Democrat holds the office, but that isn’t true. The S&P 500 has gone up regardless of who holds the office most of the time. This is because markets focus far more on what is going on with the economy than on politics. American companies find ways to be innovative and successful regardless of who is leading the country.    

While all of this noise can create market volatility, keeping your long-term goals in mind is more important than ever. We do not generate future forecasts; rather, we trust in the journey of financial planning and a disciplined investment strategy to get us through the more challenging times and stay the course. We appreciate the continued trust you place in us and look forward to serving your needs in the future.

Please don’t hesitate to contact us for any questions or conversations!

Angela Palacios, CFP®, AIF®, is a partner and Director of Investments at Center for Financial Planning, Inc.® She chairs The Center Investment Committee and pens a quarterly Investment Commentary.

Any opinions are those of the Angela Palacios, CFP®, AIF® and not necessarily those of Raymond James. The information contained in this report does not purport to be a complete description of the securities, markets, or developments referred to in this material. There is no assurance any of the trends mentioned will continue or forecasts will occur. The information has been obtained from sources considered to be reliable, but Raymond James does not guarantee that the foregoing material is accurate or complete. Any information is not a complete summary or statement of all available data necessary for making an investment decision and does not constitute a recommendation. Investing involves risk and you may incur a profit or loss regardless of strategy selected. The S&P 500 is an unmanaged index of 500 widely held stocks that is generally considered representative of the U.S. stock market. The MSCI EAFE (Europe, Australasia, and Far East) is a free float-adjusted market capitalization index that is designed to measure developed market equity performance, excluding the United States & Canada. The EAFE consists of the country indices of 22 developed nations. The Bloomberg Barclays US Aggregate Bond Index is a broad-based flagship benchmark that measures the investment grade, US dollar-denominated, fixed-rate taxable bond market. Keep in mind that individuals cannot invest directly in any index, and index performance does not include transaction costs or other fees, which will affect actual investment performance. Individual investor's results will vary. Past performance does not guarantee future results. Diversification and asset allocation do not ensure a profit or protect against a loss. Investing involves risk and you may incur a profit or loss regardless of strategy selected. Past performance is not a guarantee or a predictor of future results. Raymond James and its advisors do not offer tax or legal advice. You should discuss any tax or legal matters with the appropriate professional.

Put On Your Boxing Gloves: Active v. Passive Management

Mallory Hunt Contributed by: Mallory Hunt

Print Friendly and PDF

Tale as old as time? Not quite, but the active vs. passive management debate is a familiar one in the financial industry. An already intense deliberation has turned up the heat a couple of notches during the most recent market turmoil. So which one wins, and how does it affect you and your portfolio? Let’s start with the basics.

Active Management- What Is It?

Active management is an investment strategy in which a portfolio manager’s goal is to beat the market, take on less risk than the market, or outperform specific benchmarks. This strategy tends to be more expensive than passive management due mainly to the analysts and portfolio managers behind the scenes doing the research and frequent trading in the portfolios. 

When the market is volatile (sound familiar?), active managers have had more success in beating the market and those benchmarks. Scott Ford, the president of affluent wealth management at US Bank, claims that “active managers probably do their best work in times like this of market dislocation and stress.” In the first half of 2022, 58% of large-cap mutual funds were beating their respective benchmarks.

Even after the decline throughout the rest of the year, actively managed funds were down roughly 5% less than the S&P 500 over that same period. Much can be said regarding outperforming on the downside, and risk management is one of the potential extras investors may receive with active funds.

And Passive Management?

On the other hand, passive management is an investment strategy that focuses more on mirroring the return pattern of certain indexes and providing broad market exposure versus outperformance or risk mitigation. 

Conversely to active management, with no one handpicking stocks and trading happening less frequently, this allows passive funds to pass on lower costs to the investor and tends to assist in outperformance when put up against active funds in the long term. These funds tend to be more tax efficient and do not typically rack up much in terms of unexpected capital gains bills unless you are exiting the position, giving you control over when the capital gains are taken. In turn, the less frequent oversight provides little with regard to risk management, as investors own the best and worst companies of the index that the fund tracks. 

This easy, cheap exposure to an index has caused an influx of funds over the past four years or so, and we are at a point where passive funds (black line) have actually superseded active funds (yellow line) in the US domestic equity market as evidenced by the graph below.

So, Whose Time Is It to Shine?

As with most things, while both strategies have advantages and disadvantages, the answer may not be so black and white. The question may not be active OR passive, yet a combination of the two; this does not have to be an either/or choice. We have extensively researched the topic and implemented a balanced approach between the two in our portfolios.

Just as the market is cyclical, so is that of active and passive management. Both skilled active management and passive investing could play an important role in your investment strategy. This can be even more applicable after periods of volatility, as investors close in on meeting their investment goals.

In certain asset classes, such as US Large stocks, consistently achieving outperformance for active managers has proven more complicated, and it may make sense to rely more on passive funds. In areas like International stocks and emerging markets, it may be helpful to depend on active management where it has historically proven more beneficial.

When all is said and done, there will never be an exact strategy that works for everyone; the correct mix will still depend on you and your investment goals on a case-by-case basis.


Source: “Active vs. Passive: Market Pros Weigh In on the Best Strategy for Retail Investors”, Bloomberg News August 2022 

Mallory Hunt is a Portfolio Administrator at Center for Financial Planning, Inc.® She holds her Series 7, 63 and 65 Securities Licenses along with her Life, Accident & Health and Variable Annuities licenses.

The foregoing information has been obtained from sources considered to be reliable, but we do not guarantee that it is accurate or complete, it is not a statement of all available data necessary for making an investment decision, and it does not constitute a recommendation. Any opinions are those of the Mallory Hunt, and not necessarily those of Raymond James. Investing involves risk and you may incur a profit or loss regardless of strategy selected, including diversification and asset allocation. Keep in mind that individuals cannot invest directly in any index, and index performance does not include transaction costs or other fees, which will affect actual investment performance. Individual investor's results will vary. The S&P 500 is an unmanaged index of 500 widely held stocks that is generally considered representative of the U.S. stock market. Past performance may not be indicative of future results.

Securities offered through Raymond James Financial Services, Inc., member FINRA/SIPC. Investment advisory services are offered through Center for Financial Planning, Inc. Center for Financial Planning, Inc. is not a registered broker/dealer and is independent of Raymond James Financial Services.

Finding the Right Asset Allocation

Jaclyn Jackson Contributed by: Jaclyn Jackson, CAP®

Print Friendly and PDF

**Register for our LIVE investment event or our investment WEBINAR on Feb. 23!

Most delicious meals start with a great recipe. A recipe tells you what ingredients are needed to make the meal and, importantly, how much of each ingredient is needed to make the meal taste good. Just like we need to know the right mix of ingredients for a tasty meal, we also need to know the asset allocation mix that makes our investment journey palatable.

Determining the Right Mix

Asset allocation is considered one of the most impactful factors in meeting investment goals. It is the foundational mix of asset classes (stocks, bonds, cash, and cash alternatives) used to structure your investment plan; your investment recipe. There are many ways to determine your asset allocation. Asking the following questions will help:

  • What are my financial goals?

  • When do I need to achieve my financial goals?

  • How much money will I be investing now or over time to facilitate my financial goals?

Seasoning to Taste

Now, suppose equity markets were down 20%, and your portfolio was suffering. Would you be tempted to sell your stock positions and purchase bonds instead? Figuring out an asset allocation based on goals, time horizons, and resources is essential but means nothing if you can’t stick with it. A recipe may instruct us to “season to taste” for certain ingredients. In other words, some things are subjective, and our feelings greatly influence whether we have a negative or positive experience. For asset allocation, understanding your risk tolerance helps uncover personal attitudes about your investment strategy during challenging market scenarios. It gives insight into your ability or willingness to lose some or all of your investment in exchange for greater potential returns. When deciding our risks tolerances, we must understand the following: 

  • The risks and rewards associated with the investment tools we use.

  • How we deal with stress, loss, or unforeseen outcomes

  • The risks associated with investing

Following the Recipe

When we follow a recipe closely, our meal usually turns out how we expected. In the same way, committing to your asset allocation increases the likelihood of meeting your investment goals. Understanding your risk tolerances can reveal tendencies to undermine your asset allocation (i.e., selling or buying asset classes when we should not). Fortunately, there are a few strategies you can employ to help stay on track. 

  • If you are risk-averse, diversifying your investments between and among asset categories can help improve your returns for the levels of risks taken.

  • If you find yourself buying or selling assets at the wrong time, routinely (annually, quarterly, or semi-annually) rebalancing your portfolio will force you to trim from the asset classes that have performed well in the past and purchase investments that have the potential to perform well in the future.

  • If you find yourself chasing performance or buying investments when they are expensive, buying investments at a fixed dollar amount over a scheduled time frame, dollar cost averaging, can help you to purchase more shares of an investment when it is down relative to other assets (prices are low) and less shares when it is up relative to other assets (more expensive). Ultimately, this can lower your average share cost over time.

Finding the right asset allocation for you is one of the most important aspects of developing your investment plan. Luckily, understanding investment goals, time horizons, resources, and risk tolerances can help you mix the best recipe of asset categories to make your investment journey deliciously successful.

Jaclyn Jackson, CAP® is a Senior Portfolio Manager at Center for Financial Planning, Inc.® She manages client portfolios and performs investment research.

This information is not a complete summary or statement of all available data necessary for making an investment decision and does not constitute a recommendation. Any opinions are those of Center for Financial Planning, Inc., and are not necessarily those of RJFS or Raymond James. Every investor’s situation is unique and you should consider your investment goals, risk tolerance and time horizon before making any investment or investment decision. Investing involves risk, investors may incur a profit or loss regardless of strategy or strategies employed. Asset allocation and diversification do not ensure a profit or guarantee against a loss. Dollar-cost averaging does not ensure a profit or protect against loss, investors should consider their financial ability to continue purchases through periods of low price levels.

10 Investment Themes for Mid-Year 2022

The Center Contributed by: Center Investment Department

Print Friendly and PDF

Along with this investment commentary, we'll be answering your most commonly asked questions during market volatility, recession, and inflation in our BONUS on-demand webinar.

The first half of 2022 has seen a surge in interest rates, volatile equity and bond markets, and geopolitical conflict. All while investors have been recalibrating their expectations on the Fed’s timeline for interest rate increases. Economic data shows soaring prices and a very tight labor market, strengthening the case for the Fed to take aggressive action to tame inflation. Complicating matters for the global economy, China’s Covid-related shutdowns have exacerbated supply chain disruptions.

During these uncertain times, we want to highlight ten different themes we are thinking about right now and how they may impact your investments. However, despite these themes, it is important to remember that your financial plan is the most important theme to us through all market conditions. The financial plans we design are built to withstand markets like we are experiencing today and even worse. Everyone uses a different map to chart their destination. Some destinations are a week away, and some destinations are years away. Rest assured, your plan is designed with your final destination in mind, and this type of volatility is expected along the way!

Theme 1: Rising Risk of Recession

While no one has officially declared that the U.S. is in a recession yet, it is looking more likely that we could enter one. Two-quarters of negative GDP (one of which has already happened in the first quarter) is the traditional definition of a recession. Politics and mid-term elections will impact whether we hear recession rhetoric out of Washington, but the definition is pretty clear. The National Bureau of Economic research weighs jobs, manufacturing, and real incomes when assessing whether or not we are in a recession and not just real GDP, so this is important information to watch.  

Theme 2: Inflation

Inflation has been more persistent than many anticipated this year (including the Fed). Government stimulus money is still in bank accounts, driving our desire to purchase, which hasn’t fully been spent. This past quarter is the first time in a long time that we have finally seen this number start to level off and come down. This is likely due to higher prices. Supply chain disruptions are still present, but we are feeling some relief. Remember the chart earlier in the year that we referenced showing over 100 container ships waiting outside Los Angeles and Long Beach, California (one of the biggest ports in the country)? That number is down to 34 as of May. Chip shortages continue to persist with no end in sight, forcing companies to innovate as much as possible to manufacture items like cars with fewer chips.

Theme 3: Interest Rates

In June, the Fed responded to the higher-than-expected inflation number with a .75% rate increase, bringing the Fed funds target rate to 1.75% after .25% and .5% rate increases earlier in the year. The Fed has shown that it is ready to fight inflation and update its plan accordingly as new information becomes available. The bond market is also expecting a .5%-.75% rate increase in July. The U.S. is not alone, as 45 central banks in other nations have also increased interest rates. If inflation starts to quiet and recession data starts to accelerate, the Fed could begin to pull back on its rate-hiking plans. Quantitative tightening (Q.T.) has also begun.

The chart below shows the rate of Q.T. for the $1 trillion run rate that is anticipated. In most months this year, the Fed will let the maturities happen and not replace those bonds. Most months show more maturities than is needed, so the Fed will still be buying bonds in these months. There are only two months this year where the Fed will need to actively trim some bonds from their balance sheet (the blue bar each month shows the amount of bonds maturing on their own, and the orange bar is the amount that the Fed would need to reduce by)

Theme 4: Geopolitical Conflicts

Sadly, the Russia/Ukraine conflict continues with no resolution in sight. While these headlines are not directly impacting day-to-day market moves anymore, their repercussions from sanctions on Russia continue to affect other macro-economic factors such as rising energy prices, which directly impact inflation.

Theme 5: Mid-Term Elections

As we look at the mid-term elections this November, it does look like the Blue Wave of Democratic control is on thin ice. The three things that are against the Democrats are:

History: History suggests that the incumbent party loses around 25- 30 seats during the mid-term elections.

President’s Approval Rating: The lower the President’s approval rating, the more significant the losses. With President Biden’s approval rating around 42%, that would suggest losses closer to the 30-seat level as it is lower than usual. But the question is - will his approval rating continue to languish in the low 40s?  

Retirement: This is also a headwind from Democrats’ bid to maintain the House, as 25 sitting Democrats are retiring. This is the largest number of Democrat retirements with a Democrat in office since 1996. 

Theme 6: Cryptocurrency Volatility

Cryptocurrencies continue to make headlines. This time, however, the headlines are related to the meltdown experienced. Last year, many people touted Cryptocurrencies as the only true inflation hedge…until they were not. In the past quarter, most Cryptocurrencies have dropped more than 50%. Coinmarketcap.com shows the total market cap of all cryptocurrencies reaching a high point of $2.9 trillion last November. As of the end of the quarter, that number fell to $850 billion – a 70% crash. Additionally, some individual cryptocurrencies have fallen over 90% just this year! Speculation and volatility are and will continue to be a hallmark of this asset. Proceed with caution if you do so on your own, as this is not an asset we recommend holding as part of your long-term asset allocation!

Theme 7: Do Something or Do Nothing?

Please continue reading to see what we are doing in portfolios right now. Investors often feel the need to do something when markets are volatile, as the fight or flight instinct has been ingrained into our being for hundreds of years. If you are doing something, ensure it is driven by the right reasons, as doing the wrong things can be very costly to your long-term financial success. The graph below shows that investors, as a whole, get the timing wrong by selling low and buying high. Following the herd can result in achieving almost 50% less return (orange bar below - 5.5%) than a buy and hold investor (yellow bar below - 10.7%). Let us worry about when it is time to do something as it is often best to buy and hold.

Theme 8: Elevated Oil Prices

Energy has by far been the best performing sector in the market, but this does not mean it will be the best performing sector in the future. Usually, by the time something is making headlines, the returns have already been booked. However, looking ahead, this bought of high gas prices will do more to spur our country toward utilizing renewable resources than any lobbying group or politician could hope to accomplish on their own. As fossil fuel prices continue to rise, alternative fuels are more cost-effective and can accelerate

Theme 9: Diversification

U.S. Large Cap stocks have been the darling asset class of the past decade, which has tempted many investors to ditch other asset classes in favor of more U.S. stocks. But as 2022 has shown, there is a considerable risk in concentrating your investments into one asset class if that asset class ends up being one of the worst performers of the year. We consider it especially risky to load up on a single asset class AFTER we have already seen a vast period of outperformance like in the U.S. stock market over the past ten years. 

Global valuations are much cheaper than they are here in the U.S. Studies have shown that lower valuations tend to suggest higher returns, which is another major reason to hold your international investments. 

Grandeur Peak, one of our international investment managers, referenced this quote in their quarterly letter that we believe applies to the question of U.S. vs. international investments today: 

The mood swings of the securities markets resemble the movement of a pendulum. Although the midpoint of its arc best describes the location of the pendulum ‘on average,’ it actually spends very little of its time there. Instead, it is almost always swinging toward or away from the extremes of its arc. But whenever the pendulum is near either extreme, it is inevitable that it will move back toward the midpoint sooner or later. In fact, it is the movement toward an extreme itself that supplies the energy for the swing back.” (Howard Marks, Memo to Clients, 4/11/1991)

2022 has been painful for investment performance across almost every asset class. The silver lining, in our opinion, is that diversification is still a success story. A diversified set of asset classes has dampened the drawdown so far this year, making the hard investment times a little less painful. 

Diversification is a core principle of the Center’s investment process, making international stocks, bonds, and other alternative asset classes key components of our portfolios going forward. 

Theme 10: Portfolio Management During Market Drawdowns

We have been busy behind the scenes tax-loss harvesting, thinking about timely Roth conversions, if that is a strategy you are employing, rebalancing, and ensuring cash needs are met. We are also monitoring factors that may tell us when to lighten up on or add to equities. While these factors are meant to trigger rarely, as there is a shift in incoming information from our broad set of barometers, there may be changes in our outlook and strategy.

We encourage you to watch our on-demand webinar if you are interested in hearing more. To access the webinar, enter your email address and the webinar will be accessible immediately after!

As always, feel free to reach out if you have additional questions. We are happy to help! Until next time, enjoy your summer.

Any opinions are those of the author(s) and not necessarily those of Raymond James. The information contained in this report does not purport to be a complete description of the securities, markets, or developments referred to in this material. There is no assurance any of the trends mentioned will continue or forecasts will occur. The information has been obtained from sources considered to be reliable, but Raymond James does not guarantee that the foregoing material is accurate or complete. Any information is not a complete summary or statement of all available data necessary for making an investment decision and does not constitute a recommendation. Investing involves risk and you may incur a profit or loss regardless of strategy selected. The S&P 500 is an unmanaged index of 500 widely held stocks that is generally considered representative of the U.S. stock market. The MSCI EAFE (Europe, Australasia, and Far East) is a free float-adjusted market capitalization index that is designed to measure developed market equity performance, excluding the United States & Canada. The EAFE consists of the country indices of 22 developed nations. The Bloomberg Barclays US Aggregate Bond Index is a broad-based flagship benchmark that measures the investment grade, US dollar-denominated, fixed-rate taxable bond market. Keep in mind that individuals cannot invest directly in any index, and index performance does not include transaction costs or other fees, which will affect actual investment performance. Individual investor's results will vary. Past performance does not guarantee future results. Diversification and asset allocation do not ensure a profit or protect against a loss. Dividends are not guaranteed and must be authorized by the company's board of directors. Special Purpose Acquisition Companies may not be suitable for all investors. Investors should be familiar with the unique characteristics, risks and return potential of SPACs, including the risk that the acquisition may not occur or that the customer's investment may decline in value even if the acquisition is completed. Investing involves risk and you may incur a profit or loss regardless of strategy selected. Past performance is not a guarantee or a predictor of future results. Raymond James and its advisors do not offer tax or legal advice. You should discuss any tax or legal matters with the appropriate professional.

Securities offered through Raymond James Financial Services, Inc. member FINRA/SIPC. Center for Financial Planning, Inc. is a Registered Investment Advisor. Investment advisory services are offered through Center for Financial Planning, Inc. Center for Financial Planning, Inc. is not a registered broker/dealer and is independent of Raymond James Financial Services.

Q1 2022 Investment Commentary

The Center Contributed by: Center Investment Department

Print Friendly and PDF

Spring of 2022 feels as though it is bringing in a new wave of hope. There appears to be at least a reprieve (maybe nearing an end?) to the pandemic here in the U.S, and economic re-openings seem only to be limited by the number of staff members businesses can hire. However, the first quarter also brought many other headlines, including a severe escalation of the Russia/Ukraine conflict, increased oil prices and inflation, and higher interest rates.

It has been a rocky start to the year with a diversified portfolio ending -5.34% (40% Bloomberg US Agg Bond TR (Bonds), 40% S&P 500 TR (US Large company stocks), and 20% MSCI EAFE NR (Developed International)). There seemed to be nowhere to hide this quarter as volatility was present worldwide in equities and the fixed income markets.

Source: Morningstar Direct

Is This Market Decline Normal?

This chart shows intra-year stock market declines (red dot and number) and the market’s return for the full year (gray bar). A couple of takeaways from the below chart are important:

  • The market is capable of recovering from intra-year drops and finishing the year in positive territory.

  • This year’s correction thus far does not stick out as anything other than normally experienced corrections, even though the reasons for it may not feel normal.

Source: FactSet, Standard & Poor’s, J.P. Morgan Asset Management (Returns based on price index only and do not include dividends.  Intra-year drops refer to the largesrtmarket drops from peak to trough during the year)

Yield Curve Inversion

You may have read that the yield curve briefly inverted toward the end of the quarter after the Federal Reserve raised interest rates for the first time in this newest interest rate cycle. If not, check out our blog.

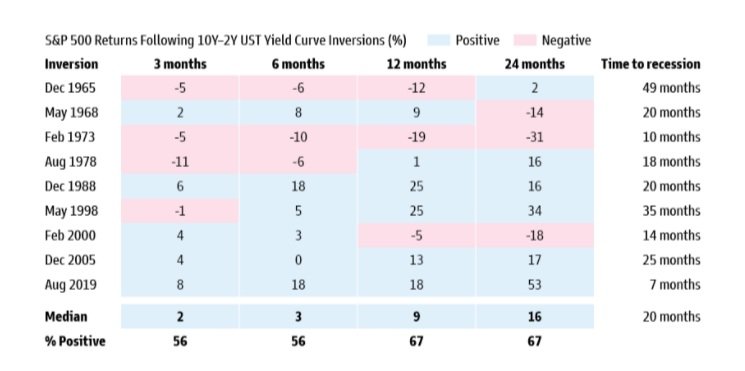
Historically, an inverted yield curve has been a signal for a coming recession. Imperfect of a signal as it is, we do take notice. This is one of several parameters we utilize at The Center for making portfolio decisions. The good news is, there is usually time before a recession hits if it does. Now that this signal has been triggered, we have a series of other signals we watch for before determining any appropriate action. Next, we seek to follow through on the economy and technical analysis because, as the chart below shows, the S&P 500 can continue to deliver positive returns (over 3, 6, 12, and 24 months) after the yield curve inverts but before recession strikes.

Source: Goldman Sachs Global Investment Research

While we may not be able to control if a recession occurs or not, we certainly can help you prepare. Here is a checklist of potential action items to consider when they happen. Many of which we take care of for you already. Any questions? Don’t hesitate to reach out!

Is Inflation Sticky?

The answer is…it depends. It depends on which contributors to inflation you are looking at. Energy is a good example. The price of a barrel of oil had a large spike (up 30%) and pullback (down 25%) all during the month of March caused by the Russia/Ukraine conflict and sanctions put in place against Russia who is a large exporter of oil (especially to Europe). Before the Russia/Ukraine conflict, energy prices rose steadily with the economic re-opening and supply limitations put in place by OPEC. This volatile component can become a large detractor just as quickly as it became a large contributor. This is why the Federal Reserve prefers to filter this noise out for its decision-making purpose and focus more on Core CPI numbers instead that eliminate food and energy due to their volatile nature. As the year continues, we may see inflation coming from the green, red, and purple areas below start to abate, leaving us with roughly 4-5% inflation (still above the Federal Reserve’s target of 2%).

Source: BLS, J.P. Morgan Asset Management

Russia/Ukraine Conflict

We will speak for everyone in saying that we are saddened by the tragic events taking place overseas in Ukraine. We continue to hope for a quick, peaceful resolution.

Markets have been increasingly volatile as the conflict unfolds, but the U.S. stock market has been shockingly positive since Russia invaded Ukraine. The one-month period from February 24th to March 24th showed the S&P 500 up ~5%. Or maybe that is not shocking when you look at how markets typically react to global conflicts. If you attended our investment event in February, you would have already seen this data. Still, the average time it has taken the market to recover from geopolitical conflict-induced drawdowns is only 47 days.

The conflict between Russia and Ukraine is shaking up stock markets, commodity markets, and providing even more uncertainty to domestic inflation and monetary/fiscal policy. During these times, it is important to remember that financial plans are built to withstand uncertainties. Diversification is more important now than ever. We will continue to monitor these events and keep you informed as we make decisions that may or may not affect investment allocations.

Key Takeaways

To summarize, here is what happened in the first quarter:

  • Stocks and bonds struggled because of inflationary pressures.

  • Commodity-linked sectors and countries benefitted, but on the other hand, growth assets and commodity importers struggled.

  • Lastly, stating the obvious, the war in Ukraine has had a negative impact on Europe.

Now that we understand what happened, we are sure you want to know how we are responding.

  1. We are monitoring our parameters to identify (if or) when it is necessary to adjust your bond to equity ratio and add duration back into the portfolio. Speaking of which, our parameters are telling us short bonds are still appropriate for investors. Remember, the higher the duration, the more a bond’s value will fall as interest rates rise. Consequently, we are maintaining a sleeve of your bond position in short-duration investments.

  2. We are taking advantage of market volatility by tax-loss harvesting. Tax-loss harvesting helps minimize what you pay in capital gains taxes by offsetting your income.

  3. Finally, we routinely review portfolios and rebalance them to capture cheap buying opportunities.

If you would like to gather more insight, we will include links to our most recent investment event and blogs. As always, we are here for you. Don’t hesitate to give us a call!

Explore More…

March FOMC Meeting: Rate Liftoff

Economic and Investment Outlook Webinar 2022

How Do I Prepare my Portfolio for Inflation?

Any opinions are those of the author and not necessarily those of Raymond James. The information contained in this report does not purport to be a complete description of the securities, markets, or developments referred to in this material. There is no assurance any of the trends mentioned will continue or forecasts will occur. The information has been obtained from sources considered to be reliable, but Raymond James does not guarantee that the foregoing material is accurate or complete. Any information is not a complete summary or statement of all available data necessary for making an investment decision and does not constitute a recommendation. Investing involves risk and you may incur a profit or loss regardless of strategy selected. The S&P 500 is an unmanaged index of 500 widely held stocks that is generally considered representative of the U.S. stock market. The MSCI EAFE (Europe, Australasia, and Far East) is a free float-adjusted market capitalization index that is designed to measure developed market equity performance, excluding the United States & Canada. The EAFE consists of the country indices of 22 developed nations. The Bloomberg Barclays US Aggregate Bond Index is a broad-based flagship benchmark that measures the investment grade, US dollar-denominated, fixed-rate taxable bond market. Keep in mind that individuals cannot invest directly in any index, and index performance does not include transaction costs or other fees, which will affect actual investment performance. Individual investor's results will vary. Past performance does not guarantee future results. Diversification and asset allocation do not ensure a profit or protect against a loss. Dividends are not guaranteed and must be authorized by the company's board of directors. Special Purpose Acquisition Companies may not be suitable for all investors. Investors should be familiar with the unique characteristics, risks and return potential of SPACs, including the risk that the acquisition may not occur or that the customer's investment may decline in value even if the acquisition is completed. Investing involves risk and you may incur a profit or loss regardless of strategy selected. Past performance is not a guarantee or a predictor of future results. Raymond James and its advisors do not offer tax or legal advice. You should discuss any tax or legal matters with the appropriate professional.

2021 Fourth Quarter Investment Commentary

The Center Contributed by: Center Investment Department

Print Friendly and PDF

As we close the books on 2021 and move into 2022, we took a few minutes to re-read our thoughts as we started the year. There was a sense of hope that the recovery would continue, jobs would recover, and the world would start to normalize. There was also worry over finalizing the election and concerns of tax rate increases. While it has been a bumpy road, the year has ended better than where we began in some very important aspects like job recovery and dodging the bullet of widely higher taxes. We do have a fresh batch of worries but also optimism looking ahead to 2022.

A diversified benchmark portfolio consisting of 60% stocks (split 40/20 between U.S.-S&P 500 and International-MSCI EAFE) and 40% bonds (Bloomberg Barclays U.S. Aggregate Bond Index) is up just over 12.5% for 2021, with the S&P 500 again leading the way at +28.71%, international stocks (MSCI EAFE) at +11.78%, and U.S. Aggregate Bonds at -1.54%. Please keep in mind indices are not available for direct investment. Any investor who attempts to mimic the performance of an index would incur fees and expenses which would reduce returns.

The good news is, for yet another year, the above hypothetical diversified portfolio would be up well over any targets we may have designed with you toward meeting financial planning goals; which should be an investor’s ultimate long term target.

Should we continue to diversify your portfolio?

Investors everywhere have been left wondering, “Why don’t I just own more U.S. stocks if they are producing such stellar returns this year while everything else (bonds or emerging) has produced very ho hum to negative results?” During these times, it is important to open our history books and remember the “lost decade.” 

We are referring to the 10 year time period throughout the 2000’s when the S&P 500 produced a negative total return. This was a very difficult time period starting with the burst of the dot-com bubble and ending with the financial crisis of 2008. Many felt like there was nowhere to hide during this time period. In reality however, those with a widely diversified portfolio had quite the opposite results. Sure a portion of their portfolio was flat to down but many of the other areas of their portfolio performed quite well over this decade, boosting their overall portfolio returns. The chart below illustrates average annual returns from some of the major Morningstar categories from 2000-2009.  The lost decade only applied to one type of investment one could own.

Chart and data courtesy John Hancock® Investments

The Center has a long history, being founded in 1985, so we have the benefit of guiding clients through many types of return environments. Coming into this lost decade, investors were asking us the very same questions we are hearing now, and the chart above shows us how that ended. While we don’t believe we are on the doorstep of another lost decade, we do feel it is not the time to abandon diversification. So, when you open your statements this year, you may see other well-known strategies that are roughly 60% Stock/40% bond up even less at just below 10% for the year. So, be careful before making any drastic changes to your portfolio. Talk to your financial planner first to determine how this might impact your long term goals!

What about Inflation?

People are saving less and spending more. Prior to the pandemic the savings rate, according to the Bureau of Economic Analysis, was roughly 7.5%, spiked up to almost 34% at the start of the pandemic in April 2020, and is now back down to 7.5%. With that large savings round trip, however, cash in bank accounts is still very high. Roughly $3.3 trillion of extra cash has accumulated in bank accounts by Americans (source: Longview Economics). All of this extra cash has served as fuel for inflation. As of the end of November, inflation readings hit a 40 year high of 6.8%. Food and energy were the main drivers of these readings. As stimulus slows, we should see spending (demand) in both of these areas level off and even decline a bit.

The Federal Reserve is now taking active measures to try to combat inflation. If you look at the history of interest rates, we have been very low for a long time. The Federal Reserve under chairs, Yellen and Powell, started to creep them back upwards as we emerged from the financial crisis. Then the pandemic struck and The Fed took them right back down near zero. Now the forecast is to start increasing rates again.

The last time we saw inflation at the levels we are at now was back in the early 1980’s. At that time, interest rates were quite high to try to bring inflation down. Sometimes we get the question of why increasing interest rates help to combat inflation. We love this question because it brings us back to the basics of economics!

Inflation is a result of too much money chasing too few goods. Right now, we have both scenarios of this equation playing out. Too much money (remember the paragraph above where we reference how much money households are holding?) chasing too few goods caused by supply chain disruptions. The basic recipe for inflation is in place. You also compound this by the base of comparison; inflation was next to nothing in 2020, teetering on the verge of deflation because no one was spending money. This is called demand-pull inflation for you economics nerds out there. There is also cost-push inflation happening and wages rising for lower income households. This also increases the price of goods and services (higher costs pushing prices higher).

So if low interest rates (cheap borrowing) and government stimulus has put money into our hands to spend and cause inflation, higher interest rates (more expensive borrowing) and no more government handouts should start to take money out of our hands for spending and therefore slowing the rate we buy things. With less demand comes lower prices or at least prices that rise at a slower pace. This is a long and slow process though. These moves by the Federal Reserve do not accomplish the task overnight. Higher interest rates take months to years to filter their way into the economy and slow inflation. Other forces may be present to help curb inflation in the new year as well. Our basis of comparison is going to rise steadily throughout 2022 and supply chain disruptions should start to ease.

Stocks are expensive.  Is now a bad time to buy?

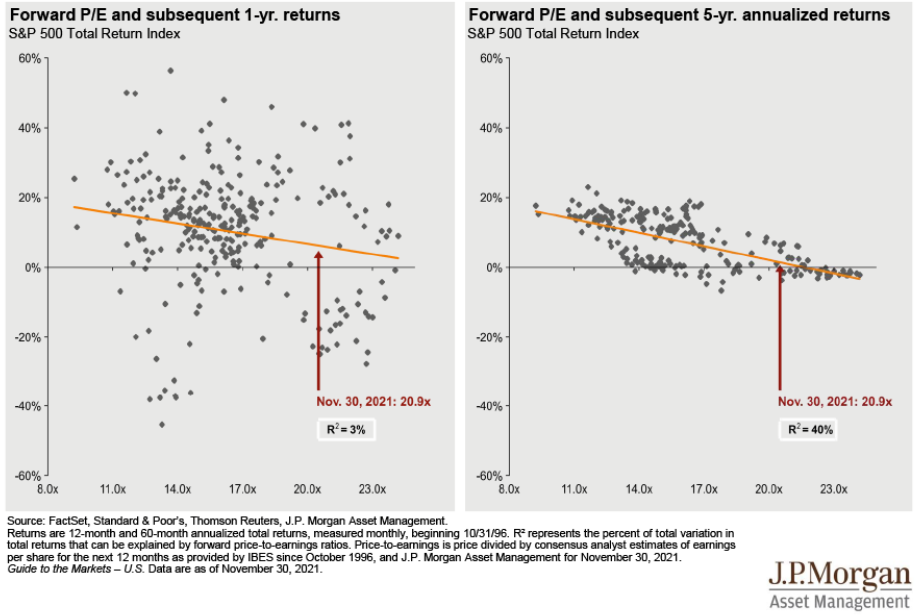
Stocks were expensive at the start of last year too, but if you avoided the S&P 500 last year then you missed out on over 28% of returns. Valuations are not everything when it comes to stock returns, and trying to time the market rarely works in investors’ favor. We are not market timers, but we do monitor the yield curve, leading economic indicators, and various commentary resources for determining our outlook for equities and bonds. Right now, our signals are still saying neutral stocks to bonds. Our research has also found that forward market performance is not correlated highly with P/E ratios.

The below chart shows how uncorrelated valuations are as a short term indicator. Sometimes, with this reading as of November 30th, the market has been up 20-40% (gray dots above the orange line in the left hand chart) one year out and sometimes it has been down 20-30% (gray dots below the orange line in the left hand chart).  Five year forward returns were all positive and in most cases positive by more than 5-6%.

International valuations are the opposite story and have been for a long time too, yet they continue to underperform.  We continue to hold them as part of the allocation because of the compelling valuation story and importance of diversification. This chart is interesting because it shows how long you can be wrong making an investment call purely on valuation. The ACWI ex-US looked like a good deal versus the U.S. 10 years ago and we know how that story has ended.

The final thing we would like you to remember if you find yourself asking “is now a bad time to buy?” is that if your portfolio is diversified, then large U.S. stocks will only make up a portion of your portfolio. In a diversified 60/40 portfolio for instance, S&P 500 stocks might only make up ¼ of your total portfolio. The other asset classes should provide different return streams or even buffer the portfolio in the event of a U.S. stock market decline. Stick to your plan, rebalance according to it, and avoid making all-in or all-out decisions that could impair your financial future.

Looking forward to 2022

We should start to see interest rates increase and, therefore, we are favoring shorter duration bonds in portfolios for now. We want to continue to let your bonds be bonds and your stocks be stocks. Bonds continue to be an important portion of your portfolio to serve as a volatility dampener while we leave our equities free to generate returns needed to achieve your financial planning goals.

The CDC is relaxing quarantine guidelines as more and more information becomes known about transmutability of the virus. This should serve to start relaxing supply chain disruptions caused by virus spikes hopefully alleviating the transitory portion of inflation. Part of the reason the U.S. performed so strongly in 2021 was a continuation of the re-opening story. We resisted further economic shutdowns despite new waves of Covid outbreaks. Overseas was a different story as outbreaks brought continued sporadic shutdowns. As immunities build and the virus continues to (hopefully) evolve into weaker strains, we should see less of this supporting stronger rallies with overseas markets.

If you are interested in hearing more about our forward-looking views, join us in February for our Economic and Investment Outlook Event. Stay tuned for details in the upcoming weeks.

Remember, we are here to help you meet your investment goals, so feel free to reach out to the investment team or your planner anytime for support. On behalf of the entire Center Team, we wish you a wonderful 2022.

Any opinions are those of the author and not necessarily those of Raymond James. The information contained in this report does not purport to be a complete description of the securities, markets, or developments referred to in this material. There is no assurance any of the trends mentioned will continue or forecasts will occur. The information has been obtained from sources considered to be reliable, but Raymond James does not guarantee that the foregoing material is accurate or complete. Any information is not a complete summary or statement of all available data necessary for making an investment decision and does not constitute a recommendation. Investing involves risk and you may incur a profit or loss regardless of strategy selected. The S&P 500 is an unmanaged index of 500 widely held stocks that is generally considered representative of the U.S. stock market. The MSCI EAFE (Europe, Australasia, and Far East) is a free float-adjusted market capitalization index that is designed to measure developed market equity performance, excluding the United States & Canada. The EAFE consists of the country indices of 22 developed nations. The Bloomberg Barclays US Aggregate Bond Index is a broad-based flagship benchmark that measures the investment grade, US dollar-denominated, fixed-rate taxable bond market. Keep in mind that individuals cannot invest directly in any index, and index performance does not include transaction costs or other fees, which will affect actual investment performance. Individual investor's results will vary. Past performance does not guarantee future results. Diversification and asset allocation do not ensure a profit or protect against a loss. Dividends are not guaranteed and must be authorized by the company's board of directors. Special Purpose Acquisition Companies may not be suitable for all investors. Investors should be familiar with the unique characteristics, risks and return potential of SPACs, including the risk that the acquisition may not occur or that the customer's investment may decline in value even if the acquisition is completed. Investing involves risk and you may incur a profit or loss regardless of strategy selected. Past performance is not a guarantee or a predictor of future results. Raymond James and its advisors do not offer tax or legal advice. You should discuss any tax or legal matters with the appropriate professional.

Tips for Managing Restricted Stock Units

Robert Ingram Contributed by: Robert Ingram, CFP®

Print Friendly and PDF

Does your employer offer company stock as part of your compensation package? There are many forms of equity compensation ranging from different types of stock awards to employee stock options (ESO) and employee stock purchase plans (ESPP). Over the last several years, Restricted Stocks Units (RSU) have become one of the most popular alternatives offered by companies. 

 Unlike pure stock awards that grant shares of stock or stock options that provide an employee the right to purchase shares at a predetermined price for a specific period of time, grants of RSUs are not actual shares of stock (yet). An RSU is essentially a promise made by the employer company to deliver to the employee shares of stock or cash payment for the value of stock shares following a vesting schedule. The vesting schedule is often based on a required length of employment, such as a three-year or four-year period, or other company performance goals. The number of units generally corresponds to shares of stock, but the units have no value until the employee receives the corresponding stock shares (or equivalent payment) when they vest.  

 How do RSUs Work? 

Let’s say your employer company grants you 1,000 Restricted Stock Units this year with a grant date of September 1st, and a 4-year vesting schedule under which 25% of the units vest each year as shares of the company’s stock. The following September 1st after the original grant date (one year later) as long as you had continued your employment, the first 25% of your 1,000 RSUs vests as actual company stock shares. Assuming the market value of the stock at the time of vesting is $50 per share, you would have 250 shares of stock worth $12,500. 

 Once the shares have vested and been delivered, you now have ownership rights such as voting rights and rights to dividend payments. You can also choose to hold or to sell the shares from that point. In each subsequent year going forward, the next 25% of your RSUs would vest until the 4th year when the remaining 250 of the 1,000 units vest. 

 One of the first important planning considerations for Restricted Stock Units is their taxation. How are RSUs taxed and how might that impact your tax situation?

 There are three triggering events with RSUs to understand.

 When You Receive RSU Grants

In most cases, at the time you receive your RSU grants, there are no tax implications. Because there is no transfer of actual property by the company until vesting in the form of shares or cash payment, the IRS does not consider the value of the stock represented by RSUs as income compensation when the grant occurs. This means the RSU grants themselves are not taxed.

 When RSUs Vest 

 Once the restricted units vest and the employer delivers the shares of stock or equivalent cash payment, the fair market value of the vested shares or cash payment as of that date (minus any amount the employee had to pay for the RSUs) is considered income and is taxed as ordinary income. Typically, companies grant RSUs without the employee paying a portion, so the full value of the vested shares would be reported as income.  

 In our example above with the 1,000 RSU grants, 250 RSUs vested with the fair market value of $50 per share for a total value of $12,500. This $12,500 would be considered compensation and would be reportable as ordinary income for that tax year. This would apply to the remaining RSUs in the years that they vest. Because this amount is treated as ordinary income, the applicable tax rate under the federal income tax brackets would apply (as well as applicable state income taxes).  

 To cover the tax withholding for this reported income at vesting, most companies allow you a few options. These may include:

  • Having the number of shares withheld to cover the equivalent dollar amount

  • Selling shares to provide the proceeds for the withholding amount

  • Providing a cash payment into the plan to cover the withholding

When You Sell Shares 

 At the time RSUs vest, the market value of those shares is reported as ordinary income. That per-share value then becomes the new cost basis for that group of shares. If you immediately sell the vested shares as of the vesting date, there would be no additional tax. The value of the shares has already been taxed as ordinary income, and the sale price of the shares would equal the cost basis of the shares (no additional gain or loss).

 If however, you choose to hold the shares and sell them in the future, any difference between the sale price and the cost basis would be a capital gain or capital loss depending on whether the sale price was greater than or less than the cost basis.  

 Once again using our example of the 1,000 RSU grants, let’s assume the fair market value of 250 shares at vesting was $50 per share and that you held those shares for over one year. If you then sold the 250 shares for $75 per share, you would have a capital gain of $25 per share ($75 - $50) for a total of $6,250. Since you held the shares for more than one year from the vesting date, this $6,250 would be taxed as a long-term capital gain and subject to the long-term capital gains tax rate of either 0%, 15%, or 20% (as of 2021) depending on your total taxable income. 

 If you were to sell shares within one year of their vesting date, any capital gain would be a short-term capital gain taxed as ordinary income. Since the federal tax brackets apply to ordinary income, you may pay a higher tax rate on the short-term capital gain than you would on a long-term gain even at the highest long-term capital gains rate of 20% (depending on where your income falls within the tax brackets).

 Planning for Additional Income

Because Restricted Stock Units can add to your taxable income (as the units vest and potentially when you sell shares), there are some strategies you may consider to help offset the extra taxable income in those years. For individuals and couples in higher tax brackets, this can be an especially important planning item.  

Some examples could include:

  • Maximizing your pre-tax contributions to your 401k, 403(b), or other retirement accounts. If you or your spouse are not yet contributing to the full annual maximum, this can be a great opportunity. ($19,500 in 2021 plus an extra $6,500 “catch up” for age 50 and above). In some cases, if cash flow is tight, it could even make sense to sell a portion of vested RSUs to replace the income going to the extra contributions.

  • Contributions to a Health Savings Account (HSA) are pre-tax/tax-deductible, so each dollar contributed reduces your taxable income. If you have a qualifying high deductible health plan, consider funding an HSA up to the annual maximum ($3,600 for individuals/$,7,200 for family coverage, plus an extra $1,000 “catch up for age 55 and above)

 Deferred Compensation plans (if available) could be an option. Many executive compensation packages offer types of deferred compensation plans. By participating, you generally defer a portion of your income into a plan with the promise that the plan will pay the balance to you in the future. The amount you defer each year does not count towards your income that year. These funds can grow through different investment options, and you select how and when the balance in the plan pays out to you, based on the individual plan rules. While this can be an effective way to reduce current income and build another savings asset, there are many factors to consider before participating. 

  • Plans can be complex, often less flexible than other savings vehicles, and dependent on the financial strength and commitment of the employer.

  • Harvesting capital losses in a regular, taxable investment account can also be a good tax management strategy. By selling investment holdings that have a loss, those capital losses offset realized capital gains. In addition, if there are any remaining excess losses after offsetting gains, you can then offset up to $3,000 of ordinary income per year. Any excess losses above the $3,000 can be carried over to the following tax year.

 When Should I Sell RSUs?

 The factors in the decision to sell or to hold RSUs that have vested as shares (in addition to tax considerations) should be similar to factors you would consider for other individual stocks or investment securities. A question to ask yourself is whether you would choose to invest your own money in the company stock or some other investment. You should consider the fundamentals of the business. Is it a growing business with good prospects within its industry? Is it in a strong financial position; or is it burdened by excessive debt? Consider the valuation of the company. Is the stock price high or low compared to the company’s earnings and cash flow?

Consider what percentage of your investments and net worth the company stock represents. Having too high a concentration of your wealth in a single security poses the risk of significant loss if the stock price falls. Not only are you taking on overall market risk, but you also have the risk of the single company. While each situation is unique, we generally recommend that your percentage of company stock not exceed 10% of your investment assets.

You should also consider your financial needs both short-term and long-term. 

Do you have cash expenses you need to fund in the next year or two and do you already have resources set aside? 

If you’re counting on proceeds from your RSUs, it could make sense to sell shares and protect the cash needed rather than risk selling shares when the value may be lower.  

 As you can see, equity compensation and specifically RSUs can affect different parts of your financial plan and can involve so many variables. That’s why it’s critical that you work with your financial and tax advisors when making these more complex planning decisions. 

So please don’t hesitate to reach out if we can be a resource.

Robert Ingram, CFP®, is a CERTIFIED FINANCIAL PLANNER™ professional at Center for Financial Planning, Inc.® With more than 15 years of industry experience, he is a trusted source for local media outlets and frequent contributor to The Center’s “Money Centered” blog.

Disclosure: While we are familiar with the tax provisions of the issues presented herein, as Financial Advisors of RJFS, we are not qualified to render advice on tax or legal matters. You should discuss tax or legal matters with the appropriate professional.