Economics

How Do I Prepare my Portfolio for Inflation?

Print Friendly and PDF

Inflation is common in developed economies and is generally healthier than deflation. When consumers expect prices to rise, they purchase goods and services now rather than waiting until later. Inflation has continued to trend higher here in the U.S. over the past year, and many are now asking, "Can this harm my portfolio's ability to help me achieve my goals?" Consider the following factors contributing to or detracting from the inflation outlook.

Our investment committee has discussed inflation at length for several years now. Here are some highlights from our discussion.

Factors influencing inflation in the short term and long term:

1. Large amount of monetary and fiscal stimulus

There has been a record amount of stimulus being pushed into the pockets of Americans by the government. The consumer is healthier than it has ever been and demanding to purchase.

2. Supply chain disruptions  

Due to shipping constraints or lack of manpower, companies can't make enough of many different products to meet current demand. Does this sound familiar? It should; because two years ago, all we could talk about was not having enough toilet paper and disinfectant wipes. People were paying high prices for even small bottles of hand sanitizer. Fast forward two years and the shelves are now overflowing with these items as prices have normalized. Once people have spent the money they accumulated over the past two years and can purchase the goods and services they want when they want to, demand will likely return to normal.

3. Starting from a very low base 

The point to which we are comparing current inflation is one of the biggest influences on the calculation. For year over year inflation, we were comparing to an economy that had very little to no economic activity occurring and was still digging out of the hole the pandemic created. When you compare something to nothing, it looks much larger than it is. Now we are starting to compare to a more normalized time, so we should see this number trend downward simply because of this anomaly.

4. Wage inflation 

One of the biggest factors in the lack of inflation over the past decade was a lack of wage inflation. We are now seeing wage inflation because companies can't hire enough people to meet the current demand for their goods or services. Wages are going up trying to entice people back to work. For many years, no wage inflation at lower-paying jobs has culminated in a resetting of wages recently (it is likely wages settle at a higher base than they were before, but it doesn't mean they will continue to rise at the pace they have been).  

5. A complete lack of velocity of money

While banks are flush with cash, they still aren't lending. Why? Because the banks, due to banking regulation changes over ten years ago, only want to loan large amounts of money to someone who is creditworthy. Creditworthy consumers are so healthy that they don't need to borrow money.

6. Technology increasing productivity

A large portion of the country increased productivity by reducing commute time via remote working capabilities over the past two years. Companies that would never have considered allowing remote work now find themselves reducing office space and making permanent shifts in working style. This is just one example of how growth in technology can increase productivity which, over time, puts downward pressure on prices. The Center is an excellent example of this. While our team is back in the office, we work a hybrid schedule of several days in the office and several days remotely.

It is important to understand what investments could do well if we are surprised and inflation is around the corner.

First of all, your starting point is very important. Are you starting from low inflation, or are your inflation levels already elevated? The answer is we are starting from a long stretch of time with very low inflation rates. So in the chart below, you would reference the lower two boxes. Then it would be best if you asked, "Is inflation rising or falling?” Low and rising inflation is in the bottom left box. You may be surprised to see the strong, average performance from varying asset classes in this scenario. Inflation that is reasonable and expected can be a very positive scenario for many asset classes.

The past year had inflation prints that many investors saw as unreasonable and unexpected. Stocks and bonds struggled because of inflationary pressures. If inflation starts to moderate, as I think it will, fear should start to diminish. In the meantime, commodity-linked sectors and countries benefitted through positions held in portfolios like real asset holdings. Diversification remains important!

Inflation assumptions are fundamental in the financial planning process. This is why it's important that we utilize Monte Carlo simulations, meaning we plan for some pretty bad scenarios in the planning process. If you would like to gather more insight or an update on your plan, don't hesitate to give us a call!

Angela Palacios, CFP®, AIF®, is a partner and Director of Investments at Center for Financial Planning, Inc.® She chairs The Center Investment Committee and pens a quarterly Investment Commentary.

The information contained in this letter does not purport to be a complete description of the securities, markets, or developments referred to in this material. The information has been obtained from sources considered to be reliable, but we do not guarantee that the foregoing material is accurate or complete. Any opinions are those of Angela Palacios CFP® AIF®, and not necessarily those of Raymond James. Expression of opinion are as of this date and are subject to change without notice. There is no guarantee that these statement, opinions or forecasts provided herein will prove to be correct. Investing involves risk and you may incur a profit or loss regardless of strategy selected, including diversification and asset allocation. Individual investor’s results will vary. Past performance does not guarantee future results. Any information is not a complete summary or statement of all available data necessary for making an investment decision and does not constitute a recommendation. Rebalancing a non-retirement account could be a taxable event that may increase your tax liability.

US GDP Unexpectedly Gives a Negative Reading

Print Friendly and PDF

As the U.S. Market entered correction territory (down 10%), another warning sign entered the state of the economy. Gross Domestic Product (GDP) for the first quarter fell at a 1.4% annualized pace. The definition of a recession is two consecutive quarters of negative GDP growth. Below is a great visual of the makeup of GDP growth this past quarter, so we can dive deeper into what is making up the negative number.

Source: Washington Post

The consumer continued to hold up its end of the bargain fairly well, contributing to nearly 2% of GDP growth as shown by personal consumption. But much of the drag this quarter came from an excessive amount of net exports (pink area), which are a negative drag to GDP. These imports were the largest ever on record this quarter as businesses worried about Russia’s invasion of Ukraine and front-loaded their imports. Also, consider that we are comparing against quarter 1 of 2021, which had a direct cash infusion by the Federal Reserve into consumers’ bank accounts. This quarter’s reading encompassed bad news like the Russia-Ukraine conflict and the biggest spike in covid cases ever here in the U.S.

All of this negative news has weighed on investor sentiment. This reading is typically a contrarian indicator, the AAII Investor Sentiment Survey, but has recently registered the worst reading since 1992. Readings were not this bad during the 2008/2009 financial crisis! Usually, a reading like this is contrarian because a market bounce generally follows it to the upside. 

So, which indicator do you follow to make investment decisions? Often we get mixed signals from markets. It is best to determine what is important to pay attention to and what might be noise so that you can have an action plan built ahead of time during periods of stress. This is no easy task and is one of the main mistakes made by do-it-yourself investors. Planning is in our name, and the importance never diminishes. If you have questions and need to speak with someone, don’t hesitate to reach out to us!

Angela Palacios, CFP®, AIF®, is a partner and Director of Investments at Center for Financial Planning, Inc.® She chairs The Center Investment Committee and pens a quarterly Investment Commentary.

The forgoing is not a recommendation to buy or sell any individual security or any combination of securities. Be sure to contact a qualified professional regarding your particular situation before making any investment or withdrawal decision. The information contained in this blog does not purport to be a complete description of the securities, markets, or developments referred to in this material. The information has been obtained from sources considered to be reliable, but we do not guarantee that the foregoing material is accurate or complete. Any opinions are those of Angela Palacios, CFP® AIF ®and not necessarily those of Raymond James. Expressions of opinion are as of this date and are subject to change without notice. There is no guarantee that these statements, opinions or forecasts provided herein will prove to be correct. Investing involves risk and you may incur a profit or loss regardless of strategy selected. Individual investor's results will vary. Past performance does not guarantee future results. Investments mentioned may not be suitable for all investors.

Q1 2022 Investment Commentary

The Center Contributed by: Center Investment Department

Print Friendly and PDF

Spring of 2022 feels as though it is bringing in a new wave of hope. There appears to be at least a reprieve (maybe nearing an end?) to the pandemic here in the U.S, and economic re-openings seem only to be limited by the number of staff members businesses can hire. However, the first quarter also brought many other headlines, including a severe escalation of the Russia/Ukraine conflict, increased oil prices and inflation, and higher interest rates.

It has been a rocky start to the year with a diversified portfolio ending -5.34% (40% Bloomberg US Agg Bond TR (Bonds), 40% S&P 500 TR (US Large company stocks), and 20% MSCI EAFE NR (Developed International)). There seemed to be nowhere to hide this quarter as volatility was present worldwide in equities and the fixed income markets.

Source: Morningstar Direct

Is This Market Decline Normal?

This chart shows intra-year stock market declines (red dot and number) and the market’s return for the full year (gray bar). A couple of takeaways from the below chart are important:

  • The market is capable of recovering from intra-year drops and finishing the year in positive territory.

  • This year’s correction thus far does not stick out as anything other than normally experienced corrections, even though the reasons for it may not feel normal.

Source: FactSet, Standard & Poor’s, J.P. Morgan Asset Management (Returns based on price index only and do not include dividends.  Intra-year drops refer to the largesrtmarket drops from peak to trough during the year)

Yield Curve Inversion

You may have read that the yield curve briefly inverted toward the end of the quarter after the Federal Reserve raised interest rates for the first time in this newest interest rate cycle. If not, check out our blog.

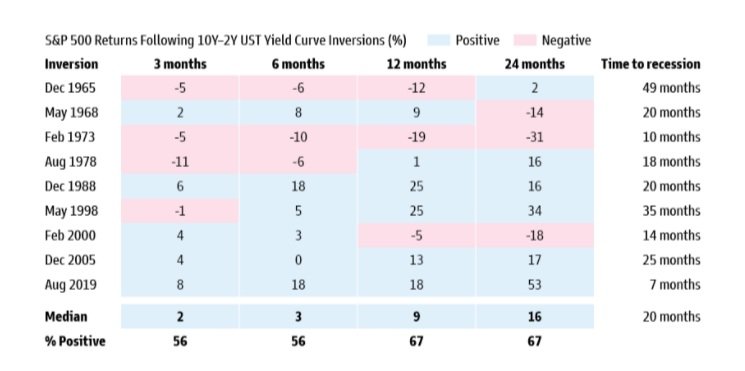
Historically, an inverted yield curve has been a signal for a coming recession. Imperfect of a signal as it is, we do take notice. This is one of several parameters we utilize at The Center for making portfolio decisions. The good news is, there is usually time before a recession hits if it does. Now that this signal has been triggered, we have a series of other signals we watch for before determining any appropriate action. Next, we seek to follow through on the economy and technical analysis because, as the chart below shows, the S&P 500 can continue to deliver positive returns (over 3, 6, 12, and 24 months) after the yield curve inverts but before recession strikes.

Source: Goldman Sachs Global Investment Research

While we may not be able to control if a recession occurs or not, we certainly can help you prepare. Here is a checklist of potential action items to consider when they happen. Many of which we take care of for you already. Any questions? Don’t hesitate to reach out!

Is Inflation Sticky?

The answer is…it depends. It depends on which contributors to inflation you are looking at. Energy is a good example. The price of a barrel of oil had a large spike (up 30%) and pullback (down 25%) all during the month of March caused by the Russia/Ukraine conflict and sanctions put in place against Russia who is a large exporter of oil (especially to Europe). Before the Russia/Ukraine conflict, energy prices rose steadily with the economic re-opening and supply limitations put in place by OPEC. This volatile component can become a large detractor just as quickly as it became a large contributor. This is why the Federal Reserve prefers to filter this noise out for its decision-making purpose and focus more on Core CPI numbers instead that eliminate food and energy due to their volatile nature. As the year continues, we may see inflation coming from the green, red, and purple areas below start to abate, leaving us with roughly 4-5% inflation (still above the Federal Reserve’s target of 2%).

Source: BLS, J.P. Morgan Asset Management

Russia/Ukraine Conflict

We will speak for everyone in saying that we are saddened by the tragic events taking place overseas in Ukraine. We continue to hope for a quick, peaceful resolution.

Markets have been increasingly volatile as the conflict unfolds, but the U.S. stock market has been shockingly positive since Russia invaded Ukraine. The one-month period from February 24th to March 24th showed the S&P 500 up ~5%. Or maybe that is not shocking when you look at how markets typically react to global conflicts. If you attended our investment event in February, you would have already seen this data. Still, the average time it has taken the market to recover from geopolitical conflict-induced drawdowns is only 47 days.

The conflict between Russia and Ukraine is shaking up stock markets, commodity markets, and providing even more uncertainty to domestic inflation and monetary/fiscal policy. During these times, it is important to remember that financial plans are built to withstand uncertainties. Diversification is more important now than ever. We will continue to monitor these events and keep you informed as we make decisions that may or may not affect investment allocations.

Key Takeaways

To summarize, here is what happened in the first quarter:

  • Stocks and bonds struggled because of inflationary pressures.

  • Commodity-linked sectors and countries benefitted, but on the other hand, growth assets and commodity importers struggled.

  • Lastly, stating the obvious, the war in Ukraine has had a negative impact on Europe.

Now that we understand what happened, we are sure you want to know how we are responding.

  1. We are monitoring our parameters to identify (if or) when it is necessary to adjust your bond to equity ratio and add duration back into the portfolio. Speaking of which, our parameters are telling us short bonds are still appropriate for investors. Remember, the higher the duration, the more a bond’s value will fall as interest rates rise. Consequently, we are maintaining a sleeve of your bond position in short-duration investments.

  2. We are taking advantage of market volatility by tax-loss harvesting. Tax-loss harvesting helps minimize what you pay in capital gains taxes by offsetting your income.

  3. Finally, we routinely review portfolios and rebalance them to capture cheap buying opportunities.

If you would like to gather more insight, we will include links to our most recent investment event and blogs. As always, we are here for you. Don’t hesitate to give us a call!

Explore More…

March FOMC Meeting: Rate Liftoff

Economic and Investment Outlook Webinar 2022

How Do I Prepare my Portfolio for Inflation?

Any opinions are those of the author and not necessarily those of Raymond James. The information contained in this report does not purport to be a complete description of the securities, markets, or developments referred to in this material. There is no assurance any of the trends mentioned will continue or forecasts will occur. The information has been obtained from sources considered to be reliable, but Raymond James does not guarantee that the foregoing material is accurate or complete. Any information is not a complete summary or statement of all available data necessary for making an investment decision and does not constitute a recommendation. Investing involves risk and you may incur a profit or loss regardless of strategy selected. The S&P 500 is an unmanaged index of 500 widely held stocks that is generally considered representative of the U.S. stock market. The MSCI EAFE (Europe, Australasia, and Far East) is a free float-adjusted market capitalization index that is designed to measure developed market equity performance, excluding the United States & Canada. The EAFE consists of the country indices of 22 developed nations. The Bloomberg Barclays US Aggregate Bond Index is a broad-based flagship benchmark that measures the investment grade, US dollar-denominated, fixed-rate taxable bond market. Keep in mind that individuals cannot invest directly in any index, and index performance does not include transaction costs or other fees, which will affect actual investment performance. Individual investor's results will vary. Past performance does not guarantee future results. Diversification and asset allocation do not ensure a profit or protect against a loss. Dividends are not guaranteed and must be authorized by the company's board of directors. Special Purpose Acquisition Companies may not be suitable for all investors. Investors should be familiar with the unique characteristics, risks and return potential of SPACs, including the risk that the acquisition may not occur or that the customer's investment may decline in value even if the acquisition is completed. Investing involves risk and you may incur a profit or loss regardless of strategy selected. Past performance is not a guarantee or a predictor of future results. Raymond James and its advisors do not offer tax or legal advice. You should discuss any tax or legal matters with the appropriate professional.

Tips for Investors During Times of Market Volatility

Print Friendly and PDF

When faced with volatility in the market, emotions can be triggered in investors that can impact their judgment and potentially affect returns. These pullbacks can make folks want to pull up stakes and run – a reaction that is often a mistake, especially for long‐term investors.

The likelihood that we will continue to see volatility this year is high. The Fed has slowed down its bond buying activities and is raising interest rates, the threat of a new COVID variant that could shut down the economy still exists, and there are supply chain and labor issues around the globe. To top it all off, we are gearing up for mid‐term elections in November.

Here are some tips to consider when we do face a volatile market. Having a plan during this time can help provide clarity, confidence, and even strategies to take advantage of the volatility.

  • First, we need to remember that market volatility is normal. As investors, when we experience long periods of upward markets with little volatility, we forget how regular market volatility really is. We need to remember that historically, the market will dip by 5% at least three times a year. Also, on average, the market will have a 10% correction once a year. Understanding that volatility is a natural process of investing and challenging to avoid can help curb some emotions triggered by these markets.

  • Make sure your employer retirement accounts are rebalanced appropriately. Over the last few years, money invested in stocks have severely outperformed the bond market. Now is a good time to revisit the allocations in your Employer‐Sponsored Retirement plans to make sure your allocation is still within your risk tolerance. You will want to make sure that your allocation to stock funds and bonds funds is appropriate for the amount of risk you want to take. If you are unsure of how you should

  • Increase Plan contributions when markets are down. For younger investors still in the accumulation stage, a volatile market is a great time to increase your contributions. Though it may seem scary to increase your contributions when markets are volatile, you are actually buying into the market when prices are on sale. Contributions added when the market is down 5‐10% from the previous high have much more earning power than contributions made when the market is up 5‐10% from its last high.

  • Have additional cash on hand to invest in dips and corrections. For investors who have been able to max out their Employer‐Sponsored plans and still have additional cash to invest, a volatile market can make for an excellent opportunity to do so. Consider talking with your advisor about moving extra cash to your investment accounts to invest on dips and corrections. Together, you can develop a strategy to get your cash invested over time or all at once, depending on market conditions.

Stumbling through bad times without a strategy makes a troubling situation even worse. If you do not have a retirement or investment plan, you will not accurately assess the damage when markets do take a dive. This could increase stress and cause investors to make bad decisions.

These periods of volatility are an opportunity to connect with your advisor, enabling them to act as a sounding board for your concerns. By talking about current events in light of your overall financial plan, your advisor can provide a reassuring perspective to help you stay the course or even invest extra cash during an opportune time.

Michael Brocavich, MBA is a CERTIFIED FINANCIAL PLANNER™ professional at Center for Financial Planning, Inc.® He has an extensive background in both personal and corporate finance.

Investing involves risk and you may incur a profit or loss regardless of strategy selected, including diversification and asset allocation. The information has been obtained from sources considered to be reliable, but we do not guarantee that the foregoing material is accurate or complete. Past Performance does not guarantee future results.

2021 Fourth Quarter Investment Commentary

The Center Contributed by: Center Investment Department

Print Friendly and PDF

As we close the books on 2021 and move into 2022, we took a few minutes to re-read our thoughts as we started the year. There was a sense of hope that the recovery would continue, jobs would recover, and the world would start to normalize. There was also worry over finalizing the election and concerns of tax rate increases. While it has been a bumpy road, the year has ended better than where we began in some very important aspects like job recovery and dodging the bullet of widely higher taxes. We do have a fresh batch of worries but also optimism looking ahead to 2022.

A diversified benchmark portfolio consisting of 60% stocks (split 40/20 between U.S.-S&P 500 and International-MSCI EAFE) and 40% bonds (Bloomberg Barclays U.S. Aggregate Bond Index) is up just over 12.5% for 2021, with the S&P 500 again leading the way at +28.71%, international stocks (MSCI EAFE) at +11.78%, and U.S. Aggregate Bonds at -1.54%. Please keep in mind indices are not available for direct investment. Any investor who attempts to mimic the performance of an index would incur fees and expenses which would reduce returns.

The good news is, for yet another year, the above hypothetical diversified portfolio would be up well over any targets we may have designed with you toward meeting financial planning goals; which should be an investor’s ultimate long term target.

Should we continue to diversify your portfolio?

Investors everywhere have been left wondering, “Why don’t I just own more U.S. stocks if they are producing such stellar returns this year while everything else (bonds or emerging) has produced very ho hum to negative results?” During these times, it is important to open our history books and remember the “lost decade.” 

We are referring to the 10 year time period throughout the 2000’s when the S&P 500 produced a negative total return. This was a very difficult time period starting with the burst of the dot-com bubble and ending with the financial crisis of 2008. Many felt like there was nowhere to hide during this time period. In reality however, those with a widely diversified portfolio had quite the opposite results. Sure a portion of their portfolio was flat to down but many of the other areas of their portfolio performed quite well over this decade, boosting their overall portfolio returns. The chart below illustrates average annual returns from some of the major Morningstar categories from 2000-2009.  The lost decade only applied to one type of investment one could own.

Chart and data courtesy John Hancock® Investments

The Center has a long history, being founded in 1985, so we have the benefit of guiding clients through many types of return environments. Coming into this lost decade, investors were asking us the very same questions we are hearing now, and the chart above shows us how that ended. While we don’t believe we are on the doorstep of another lost decade, we do feel it is not the time to abandon diversification. So, when you open your statements this year, you may see other well-known strategies that are roughly 60% Stock/40% bond up even less at just below 10% for the year. So, be careful before making any drastic changes to your portfolio. Talk to your financial planner first to determine how this might impact your long term goals!

What about Inflation?

People are saving less and spending more. Prior to the pandemic the savings rate, according to the Bureau of Economic Analysis, was roughly 7.5%, spiked up to almost 34% at the start of the pandemic in April 2020, and is now back down to 7.5%. With that large savings round trip, however, cash in bank accounts is still very high. Roughly $3.3 trillion of extra cash has accumulated in bank accounts by Americans (source: Longview Economics). All of this extra cash has served as fuel for inflation. As of the end of November, inflation readings hit a 40 year high of 6.8%. Food and energy were the main drivers of these readings. As stimulus slows, we should see spending (demand) in both of these areas level off and even decline a bit.

The Federal Reserve is now taking active measures to try to combat inflation. If you look at the history of interest rates, we have been very low for a long time. The Federal Reserve under chairs, Yellen and Powell, started to creep them back upwards as we emerged from the financial crisis. Then the pandemic struck and The Fed took them right back down near zero. Now the forecast is to start increasing rates again.

The last time we saw inflation at the levels we are at now was back in the early 1980’s. At that time, interest rates were quite high to try to bring inflation down. Sometimes we get the question of why increasing interest rates help to combat inflation. We love this question because it brings us back to the basics of economics!

Inflation is a result of too much money chasing too few goods. Right now, we have both scenarios of this equation playing out. Too much money (remember the paragraph above where we reference how much money households are holding?) chasing too few goods caused by supply chain disruptions. The basic recipe for inflation is in place. You also compound this by the base of comparison; inflation was next to nothing in 2020, teetering on the verge of deflation because no one was spending money. This is called demand-pull inflation for you economics nerds out there. There is also cost-push inflation happening and wages rising for lower income households. This also increases the price of goods and services (higher costs pushing prices higher).

So if low interest rates (cheap borrowing) and government stimulus has put money into our hands to spend and cause inflation, higher interest rates (more expensive borrowing) and no more government handouts should start to take money out of our hands for spending and therefore slowing the rate we buy things. With less demand comes lower prices or at least prices that rise at a slower pace. This is a long and slow process though. These moves by the Federal Reserve do not accomplish the task overnight. Higher interest rates take months to years to filter their way into the economy and slow inflation. Other forces may be present to help curb inflation in the new year as well. Our basis of comparison is going to rise steadily throughout 2022 and supply chain disruptions should start to ease.

Stocks are expensive.  Is now a bad time to buy?

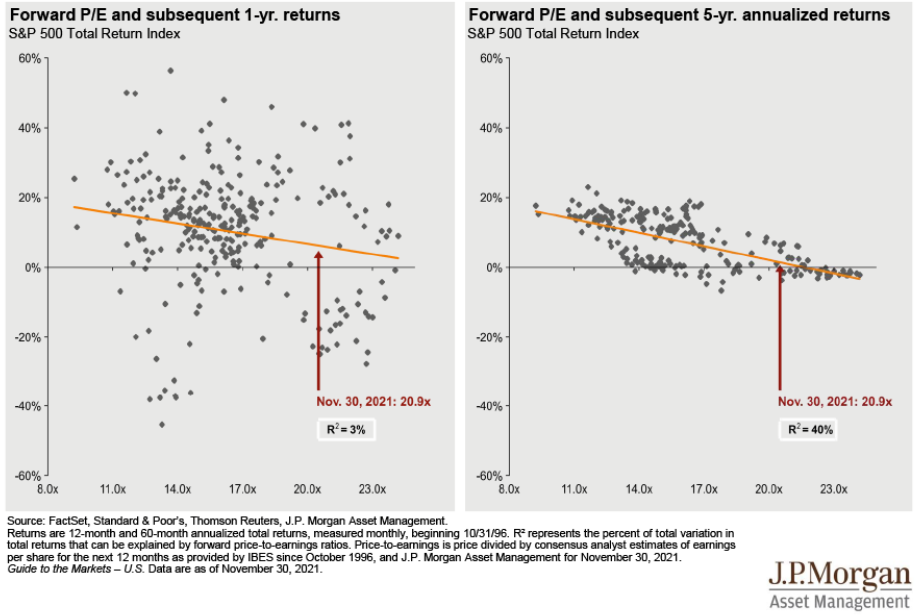
Stocks were expensive at the start of last year too, but if you avoided the S&P 500 last year then you missed out on over 28% of returns. Valuations are not everything when it comes to stock returns, and trying to time the market rarely works in investors’ favor. We are not market timers, but we do monitor the yield curve, leading economic indicators, and various commentary resources for determining our outlook for equities and bonds. Right now, our signals are still saying neutral stocks to bonds. Our research has also found that forward market performance is not correlated highly with P/E ratios.

The below chart shows how uncorrelated valuations are as a short term indicator. Sometimes, with this reading as of November 30th, the market has been up 20-40% (gray dots above the orange line in the left hand chart) one year out and sometimes it has been down 20-30% (gray dots below the orange line in the left hand chart).  Five year forward returns were all positive and in most cases positive by more than 5-6%.

International valuations are the opposite story and have been for a long time too, yet they continue to underperform.  We continue to hold them as part of the allocation because of the compelling valuation story and importance of diversification. This chart is interesting because it shows how long you can be wrong making an investment call purely on valuation. The ACWI ex-US looked like a good deal versus the U.S. 10 years ago and we know how that story has ended.

The final thing we would like you to remember if you find yourself asking “is now a bad time to buy?” is that if your portfolio is diversified, then large U.S. stocks will only make up a portion of your portfolio. In a diversified 60/40 portfolio for instance, S&P 500 stocks might only make up ¼ of your total portfolio. The other asset classes should provide different return streams or even buffer the portfolio in the event of a U.S. stock market decline. Stick to your plan, rebalance according to it, and avoid making all-in or all-out decisions that could impair your financial future.

Looking forward to 2022

We should start to see interest rates increase and, therefore, we are favoring shorter duration bonds in portfolios for now. We want to continue to let your bonds be bonds and your stocks be stocks. Bonds continue to be an important portion of your portfolio to serve as a volatility dampener while we leave our equities free to generate returns needed to achieve your financial planning goals.

The CDC is relaxing quarantine guidelines as more and more information becomes known about transmutability of the virus. This should serve to start relaxing supply chain disruptions caused by virus spikes hopefully alleviating the transitory portion of inflation. Part of the reason the U.S. performed so strongly in 2021 was a continuation of the re-opening story. We resisted further economic shutdowns despite new waves of Covid outbreaks. Overseas was a different story as outbreaks brought continued sporadic shutdowns. As immunities build and the virus continues to (hopefully) evolve into weaker strains, we should see less of this supporting stronger rallies with overseas markets.

If you are interested in hearing more about our forward-looking views, join us in February for our Economic and Investment Outlook Event. Stay tuned for details in the upcoming weeks.

Remember, we are here to help you meet your investment goals, so feel free to reach out to the investment team or your planner anytime for support. On behalf of the entire Center Team, we wish you a wonderful 2022.

Any opinions are those of the author and not necessarily those of Raymond James. The information contained in this report does not purport to be a complete description of the securities, markets, or developments referred to in this material. There is no assurance any of the trends mentioned will continue or forecasts will occur. The information has been obtained from sources considered to be reliable, but Raymond James does not guarantee that the foregoing material is accurate or complete. Any information is not a complete summary or statement of all available data necessary for making an investment decision and does not constitute a recommendation. Investing involves risk and you may incur a profit or loss regardless of strategy selected. The S&P 500 is an unmanaged index of 500 widely held stocks that is generally considered representative of the U.S. stock market. The MSCI EAFE (Europe, Australasia, and Far East) is a free float-adjusted market capitalization index that is designed to measure developed market equity performance, excluding the United States & Canada. The EAFE consists of the country indices of 22 developed nations. The Bloomberg Barclays US Aggregate Bond Index is a broad-based flagship benchmark that measures the investment grade, US dollar-denominated, fixed-rate taxable bond market. Keep in mind that individuals cannot invest directly in any index, and index performance does not include transaction costs or other fees, which will affect actual investment performance. Individual investor's results will vary. Past performance does not guarantee future results. Diversification and asset allocation do not ensure a profit or protect against a loss. Dividends are not guaranteed and must be authorized by the company's board of directors. Special Purpose Acquisition Companies may not be suitable for all investors. Investors should be familiar with the unique characteristics, risks and return potential of SPACs, including the risk that the acquisition may not occur or that the customer's investment may decline in value even if the acquisition is completed. Investing involves risk and you may incur a profit or loss regardless of strategy selected. Past performance is not a guarantee or a predictor of future results. Raymond James and its advisors do not offer tax or legal advice. You should discuss any tax or legal matters with the appropriate professional.

2021 Third Quarter Investment Commentary

The Center Contributed by: Center Investment Department

Print Friendly and PDF

Crisp Air, Cool Breeze, Fall Leaves. All the things that Autumn brings here in Michigan. As the third quarter comes to a close and we enter the last quarter of 2021, we find a cool breeze passing through markets as volatility picks up - as is often the case in September and October. A diversified benchmark portfolio consisting of 60% stocks (split between U.S.-S&P 500 and International-MSCI EAFE) and 40% bonds (Bloomberg Barclays U.S. Aggregate Bond Index) is up just over 7% year-to-date as of September 30th, with the S&P 500 leading the way at +15.9%, international stocks (MSCI EAFE) at +8.35%, and U.S. Aggregate Bonds at -1.55%.

Check out this video to recap some of our thoughts this quarter and continue to read below for some more detailed insight!

Volatility has picked up as the recovery appears to be in a holding pattern. Investors worry about the delta strain and are concerned about a surge in additional strains that could come with the winter flu season. Stock markets don’t have a clear driver of upward returns right now, and we are currently in the middle of two of the most challenging months (September and October) of the year historically for markets. Until September, the S&P 500 hadn’t experienced a 5% decline (which usually occurs 2-4 times per year) since October 2020. The market broke this long streak in late September. Headlines from the government, worry about bonds rates increasing, Chinese real estate headlines, and inflation fears have caused a pause in the steady upside we all had grown quite comfortable to!

It’s important to remember markets frequently experience short-term pullbacks. The below chart shows intra-year stock market declines (red dot and number), as well as the market’s return for the full year (gray bar). This chart shows us that the market is capable of recovering from intra-year drops and still finishing the year in positive territory, which helps us remember to stay the course even when markets get choppy!

Fed Tapering – Will It Cause Volatility?

Google searches on tapering peaked in late August and again in late September surrounding the Federal Reserve (the Fed) meeting. The Fed has fully telegraphed their intention to make this move that, likely, isn’t starting until late this year. It’s important to remember that tapering isn’t tightening. The Fed is lessening the rate they are buying government bonds. Investors wonder, “Will interest rates spike when they stop buying so much?” The answer is maybe. However, there won’t be as much debt being issued next year without fiscal stimulus as has been in the past year and a half. So, current buyers other than the Fed should be able to absorb supply. Also, U.S. Treasury bonds are still paying much more than other government’s bonds that are similar in quality. If rates go up, they will likely be met with headwinds because pension funds and other governments will want that increased yield buying the bonds and thus forcing rates back down again.

Over the summer, the Fed started to unwind the secondary market corporate credit facility that was announced early on in the pandemic to support corporate bonds and fixed income exchange-traded funds. The Fed’s holdings peaked at $14.2 Billion as the move quickly restored stability in markets at the time – March 2020 - and no further action was needed. They are planning the sales in an orderly fashion as not to disrupt markets.

Washington D.C. – A Game of Political Chicken

There have been a lot of headlines toward the end of the third quarter from the government, including government shutdown possibility, reconciliation, infrastructure bill, debt limit increase, and tax increase plans. 

First, the temporary funding bill and debt limit caused short-term volatility as investors were nervous that politicians not seeing eye-to-eye would cause another government shutdown or worse - default on U.S. debt. Fortunately, the President signed a bill funding the government through December 3rd, just hours before the deadline. You may not realize how often we have stood at this precipice before, though. According to the Congressional Research Service and MFS, “There have been 21 government shutdowns in history when our nation’s lawmakers failed to agree on spending bills to fund government outlays for a fiscal year that begins annually on October 1st. The most recent shutdown, a 35-day stoppage that ended on 1/25/19, was the longest closure in history. 11 of the 21 shutdowns lasted three days or less.” Interestingly enough, there are many similarities between now and 2013 when the FED was rolling out their plan for tapering, debt ceiling debate, and government shutdown. While what happened in the past isn’t necessarily what is going to happen now, we believe it offers a helpful perspective. You can see that in 2013 there was an uptick in volatility and a short-term market retreat, but overall the markets continued to move higher through year-end.

Source: Raymond James Chief Investment Officer, Larry Adam

Source: Raymond James Chief Investment Officer, Larry Adam

In September, we gained some clarity on the tax increase proposals to assist in paying for the infrastructure bill. Check out our blog on some of the details, as well as our upcoming webinar! Capital gains tax proposals can potentially disrupt markets in the near term, but the increase in those taxes would go into effect as of mid-September 2021 (retroactively). This is important because it prevents a rush of selling to harvest capital gains before an effective date.

China Headlines

Why has China and emerging markets lagged recently? China is the 2nd biggest economy in the world and the 2nd biggest equity market in the world. China represents 35% of the Emerging Market index, so when China lags, the entire asset class tends to lag too. Active management can be important in this area to navigate the complexities of these varying countries. China has shifted gears recently, choosing to focus on social stability (or “Common prosperity”) rather than pure growth as in the past. China’s Communist Party has turned its eye to the ultra-wealthy, politically outspoken citizens and technology usage.

Most alarmingly, however, has been Evergrande’s debt woes. Evergrande is one of China’s largest real estate developers with a massive amount of debt. They have been forced to sell off assets in order to meet debt repayments, which is having a ripple effect through their customers, suppliers, competitors, and employees. This is so impactful because one-third of China’s Gross Domestic Product is related to real estate. As you can see in the chart below, housing represents over three-quarters of financial assets in China versus a much lower percentage (less than one-third) here in the U.S.

Initially, there was fear of contagion spreading from the Chinese High Yield debt market to the U.S., but this hasn’t occurred.

We remain disciplined in the consistent and proactive execution of our investment process that is anchored in the fundamentals of asset allocation, rebalancing, and patience. From time to time, we may choose to express our forward-looking opinions of the state of stock and bond markets but always strive to do so without subjecting you to unnecessary risks. Even though we close this quarterly note similarly each time, please understand that we thank you for the trust you place in us to guide you through your investment journey!

We have more thoughts to share on investment current events coming soon. Stay tuned for our investment blogs about inflation hedges and Biden’s corporate tax rate proposal.

Angela Palacios, CFP®, AIF®, is a partner and Director of Investments at Center for Financial Planning, Inc.® She chairs The Center Investment Committee and pens a quarterly Investment Commentary.

Any opinions are those of the author and not necessarily those of Raymond James. The information contained in this report does not purport to be a complete description of the securities, markets, or developments referred to in this material. There is no assurance any of the trends mentioned will continue or forecasts will occur. The information has been obtained from sources considered to be reliable, but Raymond James does not guarantee that the foregoing material is accurate or complete. Any information is not a complete summary or statement of all available data necessary for making an investment decision and does not constitute a recommendation. Investing involves risk and you may incur a profit or loss regardless of strategy selected. The S&P 500 is an unmanaged index of 500 widely held stocks that is generally considered representative of the U.S. stock market. The MSCI EAFE (Europe, Australasia, and Far East) is a free float-adjusted market capitalization index that is designed to measure developed market equity performance, excluding the United States & Canada. The EAFE consists of the country indices of 22 developed nations. The Bloomberg Barclays US Aggregate Bond Index is a broad-based flagship benchmark that measures the investment grade, US dollar-denominated, fixed-rate taxable bond market. Keep in mind that individuals cannot invest directly in any index, and index performance does not include transaction costs or other fees, which will affect actual investment performance. Individual investor's results will vary. Past performance does not guarantee future results. Diversification and asset allocation do not ensure a profit or protect against a loss. Dividends are not guaranteed and must be authorized by the company's board of directors. Special Purpose Acquisition Companies may not be suitable for all investors. Investors should be familiar with the unique characteristics, risks and return potential of SPACs, including the risk that the acquisition may not occur or that the customer's investment may decline in value even if the acquisition is completed. Investing involves risk and you may incur a profit or loss regardless of strategy selected. Past performance is not a guarantee or a predictor of future results. Raymond James and its advisors do not offer tax or legal advice. You should discuss any tax or legal matters with the appropriate professional.

2021 Second Quarter Investment Commentary


The Center Contributed by: Center Investment Department

Print Friendly and PDF

Markets and the economy are still riding the high of greater than expected fiscal stimulus at the beginning the year, an easy Federal Reserve, and economic re-opening. Generally speaking, when economies are expected to do well, stock prices will rise and bond yields are pressured upward which pushes current bond prices down. 2021 is following that pattern. Stock markets around the world continue to climb, and bond yields here in the U.S. are rising as well. To put performance in context, we look at a simple diversified portfolio benchmark consisting of 60% stocks (split between U.S.-S&P 500 and International-MSCI EAFE) and 40% bonds (Bloomberg Barclays U.S. Aggregate Bond Index). This benchmark portfolio is up just over 7% year-to-date as of June 30th, with the S&P 500 leading the way at +15.2%, international stocks (MSCI EAFE) at +9%, and U.S. Aggregate Bonds at a quiet -1.6%.

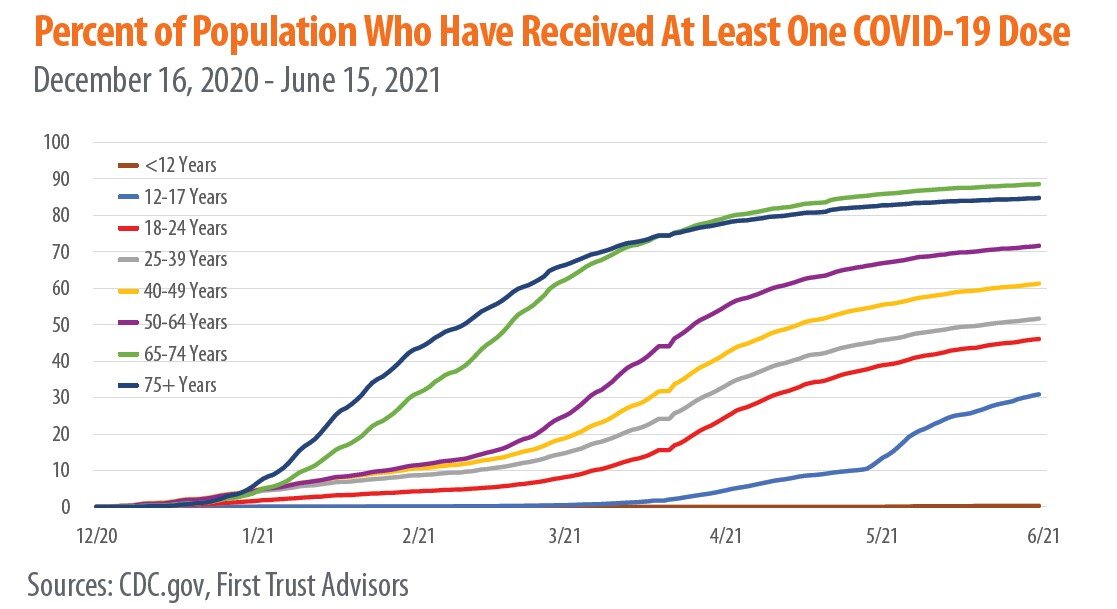
Gross Domestic Product has shown a sharp increase this year as well as inflation readings heating up (see our recent blog for more information).  Many American’s have received at least 1 dose of a COVID vaccine with high vaccination rates among our most vulnerable population 65+.  Over 80% of those individuals have received a vaccination.  Now that the 12 - 16 year old community can receive a vaccination we are only awaiting an approval of a vaccine for younger children.  It is likely we will see something later this year.

Federal Reserve (The Fed) Policy updates

Short term rates were left unchanged as expected and the monthly pace of asset purchases by the Federal Open Market Committee is unchanged.  Market expectations of future interest rate movements rely strongly on the “dot plot” which is a summary of individual projections of year-end target rates for each of the 18 senior Fed officials (even though not all of them get a vote).  Based on this, news headlines are suggesting the Fed is now targeting two rate increase by the end of the 2023.  When asked, Chairman Powell stated, “dots need to be taken with a big grain of salt.”  So it looks like the Fed maintains their outlook of keeping rates low through the end of 2023 but that the bond market may be pricing in rate hikes earlier than this.

Jobs

The Fed also notes labor force participation rates are lagging as evidenced by more job openings then people unemployed. 

Source: Bureau of Labor Statistics

Source: Bureau of Labor Statistics

This is, likely, still driven by pandemic-related issues like caregiver needs, ongoing fear of the virus and supplemental/extended unemployment insurance benefits.  As these abate we should see people returning to the workforce and the bottleneck in unemployment alleviated.  Additional government unemployment benefits were set to expire in 25 states at the end of June and the remainder of states by the end of September.  This should result in individuals returning to the labor force especially in the lower wage jobs.  We will be closely watching this to see if upward wage pressure is alleviated as people resume work.  If not, this could indicate a structural lack of labor participants and be a larger than expected driver of inflation.

Real Estate

The real estate sector benefits from the rising value of assets with rising rates as well as inflation-linked product prices and leases.  From a market standpoint, individual company level investments offer opportunity.  In other words, the sector currently favors stock pickers.  Investors who think inflation will be strong in the coming years target companies with properties that have shorter leases.  While anticipation for government-backed projects in the near future spotlight infrastructure companies.  However, what to buy is not what challenges investors when it comes to this sector.  The true challenge is understanding when to buy this sector.  For that reason, many experts like Michelle Butler, real assets portfolio specialist at Cohen & Steers, recommend having an ongoing real asset portfolio allocation to provide protection against unexpected inflation. 

From a political standpoint, our eyes are poised on Joe Biden’s American Families Plan and the implications it may have on real estate.  According to white house briefings, the American Families plan is “$1.8 trillion in investments and tax credits for American families and children over ten years. It consists of about $1 trillion in investments and $800 billion in tax cuts for American families and workers”.  One of the proposed ways of funding the plan is changing favorable tax treatment on 1031 exchanges. Traditionally, 1031 exchanges (like-kind exchanges) allow investors to defer real estate taxes by rolling profits into their next property purchase.  The new tax proposal seeks to remove tax deferments on property gains over $500,000.  While meant to largely impact the wealthiest of investors, some experts fear the proposal could also have a negative effect on small business owners.  Please note, these are just proposals and not legislation that has been introduced or passed at this point.  We are watching to see how this plays out.

Additional notes on inflation:

If inflation is less transitory and more persistent than expected it is important to understand the areas we think about leaning toward in portfolio construction.  Real Assets, Value stocks and active management within your bond portfolio to take advantage of areas like treasury inflation protection bonds can be very important.  Read all the way to the end of the above linked inflation blog to see what other asset classes might fare well in a low and rising inflationary environment.

Crypto Crash 2021

This isn’t the first time cryptocurrency has lost a majority of its value in a flash crash, and it won’t be the last. In 2012, 2015, and 2019 it fell more than EIGHTY PERCENT from its previous high. At $32,000 Bitcoin is currently about 50% off its previous high. Fun math check – in order to reach an 80% drawdown from its previous high, it would have to fall ANOTHER 60% from here. In an aggressive portfolio actively managed cryptocurrency can generate market crushing returns (or losses) depending on time of purchase and an investors ability to be disciplined in their selling strategy. Look out for a blog in the coming months for more on cryptocurrency trading, speculation, blockchain technology, and threats to the crypto industry.

Here are a few ESG investment focused recent additions to our website to check out:

The Center Social Strategy

ESG Investing: Why Everybody Is Talking About It

Not All ESG Funds Are Created Equal

The Center Social Strategy: How We Construct Values-Based Portfolios

 As always, don’t hesitate to reach out to us if you have any questions or would like to explore any of these topics further!  We appreciate the continued trust you place in us!

Angela Palacios, CFP®, AIF®, is a partner and Director of Investments at Center for Financial Planning, Inc.® She chairs The Center Investment Committee and pens a quarterly Investment Commentary.

Jaclyn Jackson, CAP® is a Portfolio Manager at Center for Financial Planning, Inc.® She manages client portfolios and performs investment research.

Nicholas Boguth is a Portfolio Administrator at Center for Financial Planning, Inc.® He performs investment research and assists with the management of client portfolios.

Opinions expressed are those of the author and are not necessarily those of Raymond James. All opinions are as of his date and are subject to change without notice. Future investment performance cannot be guaranteed, investment yields will fluctuate with market conditions. The S&P 500 is an unmanaged index of 500 widely held stocks that is generally considered representative of the U.S. stock market. The MSCI EAFE (Europe, Ausrtalasia, and Far East) is a free float-adjusted market capitalization index that is designed to measure developed market equity performance, excluding the United States & Canada. The EAFE consists of the country indices of 22 developed nations. The Bloomberg Barclays US Aggregate Bond Index is a broad-based flagship benchmark that measures the investment grade, US dollar-denominated, fixed-rate taxable bond market. Keep in mind that individuals cannot invest directly in any index, and index performances does not include transaction costs or other fees, which will affect actual investment performance. Individual investor’s results will vary. Past performance does not guarantee future results. Bitcoin issuers are not registered with the SEC, and the bitcoin marketplace is currently unregulated. Bitcoin and other cryptocurrencies are a very speculative investment and involves a high degree of risk.

The Importance of Staying Invested

Print Friendly and PDF
The+Importance+of+Staying+Invested

While trying to time the market may seem tempting during times of volatility, investors who attempt to, run the risk of missing periods of quality returns, likely leading to significant adverse effects on the ending value of a portfolio.

The image below illustrates the value of a $100,000 investment in the stock market during the 2007–18 period, which included the global financial crisis and the recovery that followed. The value of the investment dropped to $54,381 by February 2009 (the trough date), following a severe market decline. If an investor remained invested in the stock market over the next nine years, however, the ending value of the investment would have been $227,993. If the same investor exited the market at the bottom, invested in cash for a year, and then reinvested in the market, the ending value of the investment would have been $148,554. An all-cash investment at the bottom of the market would have yielded only $56,122. The continuous stock market investment recovered its initial value over the next three years and provided a higher ending value than the other two strategies. While all recoveries may not yield the same results, investors are well advised to stick with a long-term approach to investing.

The Importance of Staying Invested

Sometimes it can feel very difficult to stay invested!

Crises and Long-Term Performance

Economies and markets tend to move in cycles, and any stock market can have a downturn once in a while. Most investors lose money when the stock market goes down, but some people may think they can time the market and gain. For example, an investor may aim to buy in when the market is at the very bottom and cash out when the recovery is complete, thus enjoying the entire upside.

The problem with this type of reasoning is that it’s impossible to know when the market hits bottom. Most investors panic when the market starts to decline, then they decide to wait and end up selling after they have already lost considerable value. Or, on the recovery side, they buy in after the initial surge in value has passed and miss most of the upward momentum.

The graph illustrates the growth of $1 invested in U.S. large stocks at the beginning of 1970 and the four major market declines that subsequently occurred, including the recent banking and credit crisis. Panic is understandable in times of market turmoil, but investors who flee in such moments may come to regret it.

Each crisis, when it happens, feels like the worst one ever (the most recent one in 2008, as evidenced by the image, actually was). When viewed in isolation on the lower-tier graphs, each decline appears disastrous. However, historical data suggests that holding on through difficult times can pay off in the long run. For example, $1 invested in January 1970 grew to $117.05 by December 2018, generating a 10.2% compound annual return. And in the past, when looking at the big picture, every crisis has been eclipsed by long-term growth.

The Importance of Staying Invested

Please don’t hesitate to reach out to us when you are feeling uneasy during market volatility.  We are here, working for you!

Angela Palacios, CFP®, AIF®, is a partner and Director of Investments at Center for Financial Planning, Inc.® She chairs The Center Investment Committee and pens a quarterly Investment Commentary.


Returns and principal invested in stocks are not guaranteed. Stocks have been more volatile than bonds or cash. Holding a portfolio of securities for the long term does not ensure a profitable outcome and investing in securities always involves risk of loss. About the data: Stocks are represented by the Ibbotson® Large Company Stock Index. An investment cannot be made directly in an index. Four market crises defined as a drop of 25% or more in the index. Return is represented by the compound annual return. Recession data is from the National Bureau of Economic Research. The market is represented by the Ibbotson® Large Company Stock Index. Cash is represented by the 30-day U.S. Treasury bill. An investment cannot be made directly in an index. The data assumes reinvestment of income and does not account for taxes or transaction costs. Performance of a hypothetical investment does not reflect transaction costs, taxes, or returns that any investor actually attained and may not reflect the true costs, including management fees, of an actual portfolio. Changes in any assumption may have a material impact on the hypothetical returns presented. Illustration does not include fees and expenses which would reduce returns. The information contained in this report does not purport to be a complete description of the securities, markets, or developments referred to in this material. The information has been obtained from sources considered to be reliable, but we do not guarantee that the foregoing material is accurate or complete. Any opinions are those of Angela Palacios, and not necessarily those of Raymond James. Expressions of opinion are as of this date and are subject to change without notice. There is no guarantee that these statements, opinions or forecasts provided herein will prove to be correct. Investing involves risk and you may incur a profit or loss regardless of strategy selected. Keep in mind that individuals cannot invest directly in any index, and index performance does not include transaction costs or other fees, which will affect actual investment performance. Individual investor's results will vary. Past performance does not guarantee future results. Any information is not a complete summary or statement of all available data necessary for making an investment decision and does not constitute a recommendation.

Market Performance and Viral Outbreaks

Print Friendly and PDF
Market+Performance+and+Viral+Outbreaks

Recent market volatility caused by the spread of the coronavirus and a fear of a global economic slowdown has left many wondering if this has happened before and if so, is it different this time?  There have been numerous outbreaks in recent history that we can look at.  Below is a list of different outbreaks (many of which were far deadlier than the coronavirus) that occurred. Check out the return of the S&P 500 6 and 12 months after the epidemic.

But how about a short term global impact?  The chart below shows 1 month, 3 month, and 6 month returns of the MSCI World index.  Again, not the extreme reaction that we are feeling right now in markets. 

While there may have been short term volatility, in most cases it was short lived.

But you may still be thinking that it is different this time.   The world is far more dependent on global trade than it was during SARS in 2003 for example.  There will be some supply chain disruptions and we may not be able to source these goods from other locations quickly enough.  For example, Coca-Cola recently announced that there may be some supply disruptions in the artificial sweetener used in Diet Coke and Zero Sugar Coke…this could be devastating!  I may have to switch to drinking regular coke! Actually, I don’t drink very much pop but now that I know there could be a shortage I’m craving it!  Jokes aside, many industries may face this challenge until China is back up and running around the globe.  The trade war has actually done more to prepare us for this situation than, I think, anything could have.  Companies were already searching for supply sources outside of China or bringing production back into the U.S. after the implementation of tariffs last year.

The severity of the virus will dictate the eventual outcome. Right now investors are taking a “sell first and ask questions later” mentality. We have a lot to learn from the individuals in the U.S. under care of physicians here in the U.S. as to exactly how deadly this flu is under our system of healthcare which is one of the best in the world. Markets are selling off on a guess, right now, of where this could head. If history is any indicator, by this time next year, this should be a distant memory.

Angela Palacios, CFP®, AIF®, is a partner and Director of Investments at Center for Financial Planning, Inc.® She chairs The Center Investment Committee and pens a quarterly Investment Commentary.


There is no guarantee that these statements, opinions or forecasts provided herein will prove to be correct. Past Performance does not guarantee future results. One cannot invest directly in an index. The S&P 500 is an unmanaged index of 500 widely held stocks that is generally considered representative of the U.S. stock market. The MSCI World is a free float-adjusted market capitalization index that is designed to measure large and mid cap performance across 23 developed markets countries. The information has been obtained from sources considered to be reliable, but we do not guarantee that the foregoing material is accurate or complete.

Market Sector Impact of Donald Trump's Presidential Win

Contributed by: Jaclyn Jackson Jaclyn Jackson

By appealing to white, blue collar voters, Donald Trump unexpectedly captured rustbelt states and secured the 2016 presidential election. Additionally, Republicans made a clean sweep taking both the House and Senate majority. Uncertainty remains as many await cabinet selections and the unveiling of comprehensive policy. Market industry professionals anticipate rising performance from equity sectors that benefit from tax reform, infrastructure stimulus, and deregulation. The “Post-Election Day Winners and Losers” chart gives us insight as to how market sectors have performed post-election. Below, I’ve explored how each sector could continue to win or lose under the Trump administration.

The Winners

Industrials/Materials: Throughout the campaign trail, Trump showed great enthusiasm for infrastructure spending. Accordingly, industrials picked up after the election. Civil infrastructure companies and military contractors will likely have more opportunity for government work under his administration. As a result, the material and industrial sectors should have legs to run. 

Energy: Companies linked to fossil fuel energy may see a lift under a Republican White House because of less regulation and slower adaptation to renewable energy. Trump’s support of coal energy positions the energy sector for rebound.

Healthcare: Assuredly, the Affordable Care Act is on the agenda for repeal under the Trump administration. Companies that have benefited from Obamacare may decline. In contrast, pharmaceutical and biotech stocks have rallied due to the President-elect’s relatively lenient stance on drug pricing. Yet, there are no sure signs this sector will remain a winner since Trump also favored prescription drugs importation (unconventional for GOP policy) during his campaign run. According to Morgan Stanley analysis, prescription drug importation could negatively impact pharmaceutical companies.

Financials: Banks have rallied as Trump’s victory points towards deregulating financials. Conversely, well-known investment management corporation, BlackRock, challenged that repealing the Dodd-Frank law may result in “simpler and blunter, but equally onerous rules.”

The Losers

Treasuries: As votes tallied in favor of Trump’s victory on election night, investors fled from equities to Treasuries. The risk-off approach, however, dissipated overnight; perhaps because Trump’s victory speech was more conciliatory than expected revealing hope for moderate governance. Ultimately, U.S. Treasury concerns hinge on whether Trump’s policies widen the deficit.

Emerging Markets: Mexico’s reliance on exports to the US leave it vulnerable to tariffs/trade wars, therefore, Mexico and countries alike (Brazil, Argentina, Columbia) could sell off. We’ve already witnessed the peso falling in response to Trump’s protectionist views. On the other hand, JPMorgan’s chief global strategist, Dr. David Kelly, encouraged investors to evaluate emerging markets by their own “strengths.” China and some countries in Latin America, for example, are adjusting well to growth and lack populous sentiment. Overall, emerging markets have forward momentum with improving economies, easing monetary policies, and a global focus on spending.

Developed Markets/Euro: Companies with money overseas in the technology, healthcare, industrials, and consumer discretionary sectors, could gain from Trump’s desire to incentivize business repatriation of offshore cash. Subsequently, the Euro has fallen provided high concentrations of US based multinationals’ earnings are in Europe.

Consumer Stocks: Consumer stocks could be hurt because tougher immigration restrictions may deter labor supply and consumer demand. Additionally, policies that force tariffs on countries like China and Mexico may unintentionally pass on the costs of tariffs to US consumers.

If you have questions about your portfolio or how these “winners and losers” might affect you and your future, please reach out to your planner. We’re always here to help and answer your questions!

Jaclyn Jackson is an Investment Research Associate at Center for Financial Planning, Inc.® and an Investment Representative with Raymond James Financial Services.


The information contained in this blog does not purport to be a complete description of the securities, markets, or developments referred to in this material. The information has been obtained from sources considered to be reliable, but we do not guarantee that the foregoing material is accurate or complete. Any opinions are those of Jaclyn Jackson and not necessarily those of Raymond James. Expressions of opinion are as of this date and are subject to change without notice. There is no guarantee that these statements, opinions or forecasts provided herein will prove to be correct. Investing involves risk and you may incur a profit or loss regardless of strategy selected. This material is being provided for information purposes only and is not a complete description, nor is it a recommendation. This information is not intended as a solicitation or an offer to buy or sell any security referred to herein. Investments mentioned may not be suitable for all investors. Sector investments are companies engaged in business related to a specific sector. They are subject to fierce competition and their products and services may be subject to rapid obsolescence. There are additional risks associated with investing in an individual sector, including limited diversification. Investing in emerging markets can be riskier than investing in well-established foreign markets. Investing involves risk and investors may incur a profit or a loss. Past performance may not be indicative of future results.