Investment Planning

First Quarter Investment Pulse

Contributed by: Angela Palacios, CFP® Angela Palacios

We hit the ground running this year with a flurry of meetings with top notch investment managers.  In January Angela Palacios attended the ETF.com conference where international investing was a hot topic.  Angela shares some interesting insights along with notable quotes from some of our top money managers.

Ryan Barksdale of Vanguard: Due Diligence process

Melissa and Angela sat down with Ryan to discuss how Vanguard structures their investment committee in making key decisions as well as how they evaluate a company they are looking to bring on as a partner in making investment decisions.  Ryan discussed with us their manager oversight and selection process.  The keys in their investment selection process include low cost, top talent and patience.

Giorgio Caputo a portfolio manager and analyst at First Eagle

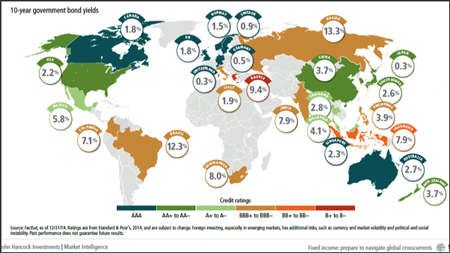
On the global front, First Eagle’s Giorgio Caputo noted that international valuations seem to be becoming more attractive relative to the US.   And with global confidence at multi-year lows and depressed earnings, if anything goes right things would start to look attractive. US quality positions have been reaching their cash targets and they’ve been replaced with overseas holding. Caputo noted that their investors pay a tax by holding cash, high quality bonds, and golds in order to get lower risk as measured by volatility in the portfolios.

It was noteworthy that Caputo was meeting with us on January 23rd, which was the day that Mario Draghi announced new quantitative easing initiatives in Europe. Caputo mentioned that the trend has been to buy on rumor and sell on fact. This seemed to be repeated with the announcements.

Discussion turned to the global fears on deflation. Caputo noted the perplexing conundrum that worldwide labor pools are shrinking as populations age, but wage growth isn’t increasing with a tighter labor pool. He blamed this on a deflation pulse which is coming from the automation of equipment. Whereas a new factory 30 years ago might have employed 1,000 workers, today a similar factory might only employ 10 or 20 people with machines taking care of the rest.

Notable Quotes from some of our top managers shareholder letters

From Steven Romick President of FPA notes it has been rough weather for some time for deep-value investors.  However, rather than letting the market’s and its price fluctuations drive them, they remain patient, picking companies that are easy to earn a return on for the price they are paying.  They have to often sit in cash and wait for these opportunities as they are now, at least partially.

Our money is invested alongside yours so we’re willing to look stupid for a time rather than act stupidly”

Rob Arnott Chairman and CEO of Research Affiliates notes that diversification in a bull market is always painful. 

History and common sense suggest some serious caution going forward, given a potentially toxic brew of historically high valuation levels, peak earnings, an economic expansion that’s about to enter its seventh year, the markets’ evident addiction to monetary stimulus as the primary fuel for further rallies, and the stark divergence between U.S. stocks and pretty much everything else.

Angela Palacios, CFP® is the Portfolio Manager at Center for Financial Planning, Inc. Angela specializes in Investment and Macro economic research. She is a frequent contributor to Money Centered as well asinvestment updates at The Center.


This material is being provided for information purposes only and is not a complete description, nor is it a recommendation. Any opinions are those of Angela Palacios and not necessarily those of Raymond James. The information has been obtained from sources considered to be reliable, but Raymond James does not guarantee that the foregoing material is accurate or complete. International investing involves special risks, including currency fluctuations, differing financial accounting standards, and possible political and economic volatility. Raymond James is not affiliated with and does not endorse the opinions or services of Ryan Barksdale, Giogio Caputo, Steven Romick, Rob Arnott, or the companies they represent.

NUA: Answering 7 Questions about Net Unrealized Appreciation

The financial planning profession is full of acronyms such as RMD, IRA, TSA and NUA. One acronym making a comeback due to the increase in the US Equity market is “NUA”. NUA stands for net unrealized appreciation and anyone with a 401k account containing stock might want to better understand it. NUA comes into play when a person retires or otherwise leaves an employer sponsored 401k plan. In many cases, 401k funds are rolled over to an IRA. However, if you hold company stock in the 401k plan, you might be best served by rolling the company stock out separately.

Before getting to an example, here are the gory details: The net unrealized appreciation in securities is the excess of the fair market value over the cost basis and may be excluded from the participant's income. Further, it is not subject to the 10% penalty tax even though the participant is under age 59-1/2, since, with limited exceptions; the 10% tax only applies to amounts included in income. The cost basis is added to income and subject to the 10% penalty, if the participant is under 59.5 and the securities are not rolled over to an IRA.

Suppose Mary age 62 works for a large company that offers a 401k plan. Over the years she has purchased $50,000 of XYZ company stock and it has appreciated over the years with a current value of $150,000. Therefore, Mary has a basis of $50,000 and net unrealized appreciation of $100,000.

If Mary rolls XYZ stock over to an IRA at retirement or termination, the full $150,000 will be taxed like the other funds at ordinary income tax rates when distributed. However, if Mary rolls XYZ stock out separately the tax rules are different and potentially more favorable. In the example above, if Mary rolls XYZ out she will pay ordinary income tax immediately on $50,000 but may obtain long term capital treatment on the $100,000 appreciation when the stock is sold; thus potentially saving several thousand dollars in income tax.

Here are some critical questions to review when considering taking advantage of this opportunity:

Have you determined whether you own eligible employer stock within your workplace retirement plan?

Have you determined whether you have a distribution triggering event that would allow you to take a lump sum distribution of your employer stock from your plan?

Have you discussed the special taxation rules that apply to lump sum distributions of employer stock and NUA?

  • Cost basis taxable as ordinary income

  • Net unrealized appreciation taxable at long term capital gains rates when stock is sold

Have you discussed the criteria necessary to qualify for NUA’s special tax treatment?

  • Qualifying lump sum distribution including stock of the sponsoring employer taken within one taxable year

  • Transfer of stock in kind to a brokerage account

  • Sale of stock outside of the current qualified plan

Have you discussed the pros and cons of rolling over your employer stock into an IRA, taking into consideration such things as available investment options, fees and expenses, services, taxes and penalties, creditor protection, required minimum distributions and the tax treatment of the employer stock?

Have you discussed the pros and cons of selling your employer stock within the plan, including the need for proper diversification?

Have you discussed with your tax advisor whether a NUA tax strategy would be beneficial from a tax planning perspective given your current situation?

These are a handful of the key questions that should be considered when deciding whether or not this opportunity makes sense for you. Professional guidance is always suggested before making any final decisions.

Matthew Trujillo, CFP®, is a Certified Financial Planner™ at Center for Financial Planning, Inc. Matt currently assists Center planners and clients, and is a contributor to Money Centered.


This material is being provided for information purposes only and is not a complete description, nor is it a recommendation. Any opinions are those of Matt Trujillo, CFP® and Tim Wyman, CFP® and not necessarily those of Raymond James. The information has been obtained from sources considered to be reliable, but Raymond James does not guarantee that the foregoing material is accurate or complete. Strategies mentioned may not be appropriate for all investors.

Where to look for Bond Yield

Finding yield has become a struggle for investors today.  At the beginning of 2014, most experts were expecting the yield on U.S. 10-year Treasuries to end the year well above 3%.  However, they ended up going down from where they started the year and finished at 2.2% (and are even lower today).  Many were left scratching their heads as to why this could have happened.  However, when you look at the high quality government bond options around the would you can start to understand why. It’s all relative. 

Mapping 10-year Government Bond Yields

First of all, not much of the world is considered “high quality”.  The turquoise countries in the graphic below are the only countries that receive the coveted AAA rating.  This includes Canada, Australia, Singapore and much of Europe.  There are a few countries in the AA rating, or bright green color coding camp, which is where the United States falls. 

Second, look at the yields these countries pay.  Of the AA and AAA rated countries, U.S. Treasuries at 2.2% have the most attractive rates for the credit quality and also perceived quality by others.  Would you want to buy 10-year Chinese government bonds for only 1.5% more yeild over the U.S. (3.7% versus 2.2%)?  The answer is generally no with the bulk of your fixed income assets.

20150205c.jpg

Many governements, institutions and pension funds agree.  So U.S. bonds are aggressively bought when their rates go up, even a little, by institutions and governments because they are a safe haven with the best relative yields out there. This buying then drives the rates right back down again.  The blue bars on the chart below show month-by-month how many trillions of U.S. Treasuries are owned by foreign governments.  You can see as tapering occurred (indicated by the green boxes in $’s), the U.S. pulled back on the amount of bonds it was buying, then yields would spike (see the purple line) and foreign governments would buy.

20150205d.jpg

Now, with Europe embarking on its own bond buying program, yield curves and thus rates in Europe are going to come down even further. This is likely to make this phenomena even more pronounced.  For at least the near term, it is likely we will be stuck with lower rates here in the U.S. and around the world as these trends persist.

Angela Palacios, CFP®is the Portfolio Manager at Center for Financial Planning, Inc. Angela specializes in Investment and Macro economic research. She is a frequent contributor to Money Centered as well asinvestment updates at The Center.

This material is being provided for information purposes only and is not a complete description, nor is it a recommendation. Any opinions are those of [insert FA name] and not necessarily those of Raymond James. The information has been obtained from sources considered to be reliable, but Raymond James does not guarantee that the foregoing material is accurate or complete. There are special risks associated with investing in bonds (fixed income) such as interest rate risk, market risk, call risk, prepayment risk, credit risk, and reinvestment risk. There is an inverse relationship between interest rate movements and fixed income prices. Generally, when interest rates rise, fixed income prices fall and when interest rates fall, fixed income prices generally rise. International investing involves special risks, including currency fluctuations, different financial accounting standards, and possible political and economic volatility. C15-003427

Investment Commentary - January 2015

2014 was highlighted by the continued dominance of America’s large cap stock bull market and a bond surprise with US treasuries providing returns to investors. We like to think of markets in cycles and you may be feeling more and more used to stock returns as it’s been more than five years since we had negative returns in US large company stocks (generally). Moreover, you may wonder why you would own anything but US stocks and bonds given a divergence of returns between US large companies and almost everything else.

The Curse of Diversification?

If you have a diversified portfolio of different types of stocks and bonds as we recommend through asset allocation, it may to be frustrating to see the largest US benchmarks with double-digit returns while other different types of stocks have been more mediocre. Using 2014 as an example, small cap stocks as measured by the Russell 2000 were up 4.89% vs. 13.69% for the S&P 500. Meanwhile, foreign stocks as measured by the MSCI All-Cap World Ex-US were down for the year return -3.87%.

As you can see from the chart below, the drop-off was precipitous. While we have made some adjustments to our recommended mix of stocks, we continue to recommend a commitment to diversification.

It is difficult to overstate the power that diversification has in terms of long-term investment returns. By long-term, we don’t mean one year or three years but over decades which is ultimately the time horizon for most of our clients at least for some of your money. Indeed, the SEC refers to “The Magic of Diversification” on their website educating investors. They go on to note, “The practice of spreading money among different investments to reduce risk is known as diversification. By picking the right group of investments, you may be able to limit your losses and reduce the fluctuations of investment returns without sacrificing too much potential gain.” Source.

Bond Redux

While we have been amongst the majority of investors who have been concerned about rising interest rates over the next five to ten years, bonds reiterated their unwillingness to be predictable in 2014 by returning close to their lows in terms of yields. The ten-year treasury yields 1.93% today (January 12). That number seems impossibly low, likely manipulated by a very accommodating federal reserve. It’s not difficult, though, to see why it may stay that low for some time when you notice that the German ten-year bond yields 0.47% and a Spanish bond – much less creditworthy than Uncle Sam – pays just 1.64%.

Predicting short-term bond returns is a fool’s errand. That said, the very low bond yield – about the same as inflation – coupled by forewarning from the federal reserve that rates may go higher this year means our outlook is unchanged. From year-to-year we can’t predict the returns of bonds, but over the next several years, yields will likely go higher. This march higher would be likely to accelerate if there were signs of inflation which seems to be the farthest thing from reality with CPI less than 2% right now. As with all things, it’s healthy to not assume anything.

We have more to share in our investment commentary website http://centerinvesting.com.

You will not find us making predictions for investment returns in 2015. We can predict that your commitment to financial planning coupled with a long-term outlook when working with us to make investment decisions will have a positive impact on your ability to meet your financial and life goals. We appreciate your partnership and trust in allowing us to work together to meet your needs.

As always, please don’t hesitate to contact us for any questions or conversations.

On behalf of everyone here at The Center,

Melissa Joy, CFP®
Director of Wealth Management

Melissa Joy, CFP®is Partner and Director of Investments at Center for Financial Planning, Inc. In 2013, Melissa was honored by Financial Advisor magazine in the Research All Star List for the third consecutive year. In addition to her contributions to Money Centered blogs, she writes investment updates at The Center and is regularly quoted in national media publications including The Chicago Tribune, Investment News, and Morningstar Advisor.

Financial Advisor magazine's inaugural Research All Star List is based on job function of the person evaluated, fund selections and evaluation process used, study of rejected fund examples, and evaluation of challenges faced in the job and actions taken to overcome those challenges. Evaluations are independently conducted by Financial Advisor Magazine.

This material is being provided for information purposes only and is not a complete description, nor is it a recommendation. Any opinions are those of Melissa Joy & Center for Financial Planning, Inc. and not necessarily those of Raymond James. The information has been obtained from sources considered to be reliable, but Raymond James does not guarantee that the foregoing material is accurate or complete. Investing involves risk and you may incur a profit or loss regardless of strategy selected. Keep in mind that individuals cannot invest directly in any index, and index performance does not include transaction costs or other fees, which will affect actual investment performance. Individual investor's results will vary. Past performance does not guarantee future results. The S&P 500 is an unmanaged index of 500 widely held stocks that is generally considered representative of the U.S. stock market. The Russell 2000 index is an unmanaged index of small cap securities which generally involve greater risks. MSCI EAFE (Europe, Australasia, and Far East) is a free float-adjusted market capitalization index that is designed to measure developed market equity performance, excluding the United States & Canada. The EAFE consists of the country indices of 22 developed nations. C15-001750

Investment Pulse Fourth Quarter

invcom_20140417b.jpg

While the end of the year is busy with processing RMD’s, charitable gifting and loss harvesting we still find time to dedicate to research.  In the last few months of the year we heard from a wide variety of money managers and got their take on the markets.

Kathleen Gaffney, Portfolio Manager for Eaton Vance

  • Kathleen feels like they have reached an inflection point in the bond market, even though fundamentals for the economy are still positive, high yield is selling off and investors seem to be bracing for higher rates to come.

  • She feels the risk worth taking at this time is found in the equity markets in companies with good fundamentals.

  • There is so much cash on the sidelines now that every time there is a selloff in bonds causing rates to rise there are many buyers swooping in to buy up the bonds bringing the rates right back down.

Joe Zidle of Richard Bernstein advisors

Often seen on CNBC, Joe came to Detroit to share some of his company’s views of the markets in general.  They have many interesting and often differing viewpoints from the consensus. 

  • He describes the market now as a secular equity bull.  “Bull markets don't end with skepticism, they end with euphoria.  Markets can't be overvalued if people are uncertain.”

  • There is still a lack of capital spending by U.S. companies to invest in the future of their businesses.  94% of S&P 500 companies are putting money into share buybacks and dividends rather than in capital spending. 

  • He says we are still early in the business cycle.  Business cycles start here in the U.S., go to Europe and then finally the emerging markets.  They see the emerging markets and China as still “in a bubble” while Europe is still correcting.

Jeff Rosenburg CIO of Fixed Income for Blackrock

Jeff is another expert who is often seen on CNBC.  Jeff stopped worrying about bonds and learned to love them in 2014.

  • According to Jeff, where you hold your duration (by maturity) matters as much to returns as how much duration you own.  Active management can help a portfolio by managing this.

  • He says high-yield bonds will take on more interest rate sensitivity.   They tend to be shorter maturity bonds as these companies aren’t trusted enough to loan to them for longer periods of time. This will subject them to more interest rate sensitivity than normal when short rates start to rise.

Angela Palacios, CFP®is the Portfolio Manager at Center for Financial Planning, Inc. Angela specializes in Investment and Macro economic research. She is a frequent contributor to Money Centered as well asinvestment updates at The Center.

The information contained in this report does not purport to be a complete description of the securities, markets, or developments referred to in this material. The information has been obtained from sources considered to be reliable, but we do not guarantee that the foregoing material is accurate or complete. Any information is not a complete summary or statement of all available data necessary for making an investment decision and does not constitute a recommendation. Any opinions are those of Angela Palacios and not necessarily those of RJFS or Raymond James. Prior to making an investment decision, please consult with your financial advisor about your individual situation.

Why I Disliked my Diversified Portfolio in 2014

invcom_20150116bb.jpg

Let’s face it; we live in a headline kind of world these days. One of the fastest growing media outlets, Twitter, only allows 140 characters. They might as well rename it “Headwitter”! I was reminded of the power of headlines recently as I was reviewing my personal financial planning; reflecting on the progress I have made toward goals such as retirement, estate, tax, life insurance, and investments. And, after reviewing my personal 401k plan, and witnessing single digit growth, my immediate reaction was probably similar to many other investors that utilize a prudent asset allocation strategy (40% fixed income and 60% equities). I’d be less than candid if I didn’t share that my immediate thought was, “I dislike my diversified portfolio”.

The headlines suggest it should have been a better year. However, knowing that the substance is below the headlines, and 140 characters can’t convey the whole story, my diversified portfolio performed just as it is supposed to in 2014.

The Financial Headlines

The financial news -- whether it be radio, print, or social media -- almost entirely focuses on three major market indexes; the DJIA, the S&P 500 and the NASDAQ. All three are barometers for Large Stocks in the United States; they are meaningless for additional assets found in a diversified portfolio such as international stocks, small and medium size stocks, and bonds of all varieties. It is true that large US stock indexes were at or near all-time highs throughout 2014.  It is also true that many other major asset classes gained no ground or were even negative for the year including: high yield junk bonds, small cap stocks, commodities, metals, energy, international stocks and emerging markets. Moreover, even within US large stocks there was vast disparity as large cap value stocks lagged large growth stocks by almost 50%!

How to Dig Deeper into Strategy & Outlook

Our firm utilizes a variety of resources in developing our economic outlook and asset allocation strategies including research from well-respected firms such as Russell Investments and Raymond James. Review the “Russell Balanced Portfolio Returns” graphic that provides a useful visual on how a variety of asset classes have performed since 2005. (Click below image to enlarge.)

This chart shows the historical performance of different asset classes, as well as an asset allocation portfolio (35% fixed & 65% diversified equities). The asset allocation portfolio incorporates the various asset classes shown in the chart and highlights how balance and diversification can help reduce volatility (risk) and enhance returns.Risk adjusted returns are always a worthy goal and, as I have written in the past, risk is always present and matters.

Do you recall 2008-2009 or how about the lost decade of 2000-2010? If you “see” a pattern in asset class returns over time, please look again. There is no determinable pattern. Asset class returns are cyclical and it’s difficult to predict which asset class will outperform in any given year. A portfolio with a mix of asset classes, on average, should smooth the ride by lowering risk over a full market cycle. I’d suggest if there is any pattern to see, it would be that a diversified portfolio should provide aless volatile investment experience than any single asset class. A diversified portfolio is unlikely to be worse than the lowest performing asset class in any given year, and on the flip side it is unlikely to be better than the best performing asset class. Just what you would expect!

Staying Focused & Disciplined

The current environment reminds me of the strong US stock market experienced in the late 1990’s.  During that time, unfortunately some folks were willing to abandon discipline because of increased greed or conversely, increased fear. Currently I sense an interesting phenomenon, an increase in fear. Not of markets going down, but rather a fear of being left behind in such a strong US stock market. As important as it is not to panic out of an asset class after a large decline, it remains equally important not to panic into an asset class. I believe maintaining discipline in both environments is critical to investment success.

Like the late 1990’s, many folks have taken note of the S&P 500’s outperformance of many other asset classes over the last five years and wonder why they should invest in anything else. The question is understandable. If you find yourself asking the same question, you might consider the following:

  • The S&P 500 Index has had tremendous performance over the last five years, but it’s difficult to predict which asset class will outperform from year to year. A portfolio with a mix of asset classes, on average, should smooth the ride by lowering risk over a full market cycle.

  • Fundamentally, prices of U.S. companies are hovering around the long-term average. International equities, particularly the emerging markets, are still well below their normal estimates and may have con­siderable room for improvement.

  • U.S. large caps, as defined by the S&P 500 Index, have outperformed international equities (MSCI EAFE) four of the last five years. The last time the S&P outperformed for a significant time 1996-2001, the MSCI outperformed in the subsequent six years.

Managing Risk

Benjamin Graham, known as the “father of value investing”, dedicated much of his book, The Intelligent Investor, to risk.  In one of his many timeless quotes he says, “The essence of investment management is the management of risks, not the management of returns.”  This statement can be counterintuitive to many investors.  As I have shared before, risk does not have to be an alarm; rather a healthy dose of reality in all investment environments. That’s how we meet life’s financial goals. Diversification is about avoiding the big setbacks along the way – it doesn’t protect against losses – it is used to manage risk.

So, if you are feeling like I did initially about your portfolio, hopefully after review and reflection you might also change your perspective like I did from “I dislike my diversified portfolio” to “My diversified portfolio - just what I would expect”. As always, if you’d like to schedule some time to review anything contained in this writing or your personal circumstances, please let me know. Lastly, our investment committee has been hard at work for several weeks and will be sharing 2015 comments in the near future. Make it a great 2015!

Timothy Wyman, CFP®, JD is the Managing Partner and Financial Planner at Center for Financial Planning, Inc. and is a frequent contributor to national media including appearances on Good Morning America Weekend Edition and WDIV Channel 4 News and published articles including Forbes and The Wall Street Journal. A leader in his profession, Tim served on the National Board of Directors for the 28,000 member Financial Planning Association™ (FPA®), trained and mentored hundreds of CFP® practitioners and is a frequent speaker to organizations and businesses on various financial planning topics.

Required Disclaimer: This material is being provided for information purposes only and is not a complete description, nor is it a recommendation. Any opinions are those of Tim Wyman and not necessarily those of Raymond James. The information has been obtained from sources considered to be reliable, but Raymond James does not guarantee that the foregoing material is accurate or complete. The Dow Jones Industrial Average (DJIA), commonly known as “The Dow” is an index representing 30 stock of companies maintained and reviewed by the editors of the Wall Street Journal. The S&P 500 is an unmanaged index of 500 widely held stocks that is generally considered representative of the U.S. stock market. The NASDAQ Composite Index is an unmanaged index of securities traded on the NASDAQ system. MSCI EAFE (Europe, Australasia, and Far East) is a free float-adjusted market capitalization index that is designed to measure developed market equity performance, excluding the United States & Canada. The EAFE consists of the country indices of 22 developed nations. Inclusion of these indexes is for illustrative purposes only. Keep in mind that individuals cannot invest directly in any index, and index performance does not include transaction costs or other fees, which will affect actual investment performance. Individual investor's results will vary. Past performance does not guarantee future results. Diversification and asset allocation do not ensure a profit or protect against a loss. Raymond James is not affiliated with Benjamin Graham.

SRI: Investing in your Ideals & Values

Socially responsible investing (SRI) is a rapidly expanding option in the investment arena.  This includes Environment, Social and Governance (ESG) criteria in the stock and bond selection process.  This approach to investing looks beyond simple financial return, allowing individuals and institutions to express their personal values and ideals with their investments.

Millennials more interested in ESG strategies

We are starting to see generational differences in investing as younger high net worth investors are more interested in expressing their values through investing.   For example, in a survey conducted by U.S. Trust Insights, 63% of Millennials (individuals born between 1980 and 2000) are interested in owning socially responsible strategies versus just 35% of the total number of responders.  These investors believe that they also don’t have to give up returns in order to do so as 60% believe it is possible to achieve market rates of returns while investing in ESG strategies.

Source: U.S. Trust Insights on Wealth and Worth Annual Survey

The Center Expands ESG Recommendations

Based on increasing demand from our clients, our investment committee and research department have expanded our recommended list to include companies that offer these types of investment strategies.  Having applied our same rigorous due diligence process to these selections, we feel we have an excellent combination of managers in a variety of asset classes that will allow our clients to express their ideals in the way they invest their assets (see our recent blog on this).  If you are looking for ways to express your values through your investments don’t hesitate to contact us!

Angela Palacios, CFP®is the Portfolio Manager at Center for Financial Planning, Inc. Angela specializes in Investment and Macro economic research. She is a frequent contributor to Money Centered as well as investment updates at The Center.

Links are being provided for information purposes only. Raymond James is not affiliated with and does not endorse, authorize or sponsor any of the listed websites or their respective sponsors. Raymond James is not responsible for the content of any website or the collection or use of information regarding any website’s users and/or members. Investing always involves risk and you may incur a profit or loss. No investment strategy can guarantee success. Material is provided for informational purposes only and does not constitute a recommendation. C14-040265

Benchmarking in Investing: Tools to track relative performance

 Ever wonder how to know whether your portfolio is performing well?  Some people will simply look at the overall return, and if it’s higher than their neighbor’s, they figure they are doing well!  However, simply looking at the bottom line rate of return doesn’t tell the whole story because returns are directly related to how much underlying risk you have taken in the portfolio. To an amateur investor an annual rate of return of 7-8% might feel good, but a professional looks at how much risk you had to take to achieve such a result.  One method everyone should use to better understand the relative performance of an individual portfolio is referred to as “benchmarking”. 

Performance tracking methods

A few commonly used benchmarks for large U.S. stocks are the Dow Jones Industrial Average and the Standard & Poor’s 500 index (more commonly known as the S&P 500).  You will hear these two indexes referred to constantly in the news. If you hear the Dow was up 100 points, you may find yourself checking how your portfolio’s performance compares.  The problem with this is that you might not own anything in your portfolio that looks anything like the Dow Jones Index. This is why you need to understand what makes up your portfolio and what indexes to track to understand relative performance. 

Benchmarking Best Practices

Hypothetically, let’s say you have a portfolio that looks like this:

30% Large International Stocks

30% Large U.S. Stocks

40% highly rated U.S. corporate bonds   

You look at the annual return for the Dow Jones, see that this particular index was up 9% at the end of the year, and then check your portfolio’s overall return to see that it was only up 4%.  Before you rush to the phone to fire your financial advisor, first get the full picture!  Your portfolio only has 30% of the money invested in Large U.S. companies and 70% of the money invested elsewhere. To expect 100% of the money to perform the same as the Dow Jones is highly unrealistic.  Instead, you should look at a few other “benchmarks” that are commonly used in financial circles to track different types of stocks and bonds.

Here is a list of benchmarks to track different asset classes to help you make a fair comparison about your portfolio’s performance compared to the types of risk you took:

S&P 500-  Large U.S. Stocks

Russell 2000- Small U.S. Stocks

MSCI EAFE- International Stocks

Barclays Aggregate U.S. Bond Index- U.S. Bonds

Back to the example, our hypothetical investor decides to look up the returns for the Barclays Aggregate Index and MSCI EAFE since he has money invested in those types of asset classes as well as Large U.S. Stocks.  Our investor sees that bonds actually had a negative 2% rate of return for the same time frame, and that the MSCI EAFE was essentially flat.  So 30% of his money he expects to be up somewhere near 9%, 30% of his money he expects to be right around 0%, and 40% of his money he expects to be down 2%. 

Putting Performance Benchmarking to Work

If our investor had $100,000 at the beginning of the year invested in our hypothetical portfolio here’s how it breaks down:

Add it up and the ending portfolio balance is $101,900 or a rate of return of 1.9%.  When you understand the whole picture, you might be more satisfied with a 4% return knowing that a portfolio with very similar holdings should only be up about 1.9% according to the benchmarks.

Talk to your financial advisor to find out what makes up your portfolio and what benchmarks to use for your particular situation.

Matthew Trujillo, CFP®, is a Certified Financial Planner™ at Center for Financial Planning, Inc. Matt currently assists Center planners and clients, and is a contributor to Money Centered.


Information contained in this report was received from sources believed to be reliable, but accuracy is not guaranteed. The Dow Jones Industrial Average is an unmanaged index of 30 widely held securities. It is not possible to invest directly in an index. C14-038979

Capital Gains: Minimizing Your Tax Drag

The difference between the tax man and the taxidermist is the taxidermist leaves the skin."  Mark Twain

As the bull market marches on, many investors find the capital losses they have carried over since 2008 are gone.  Likewise, many investment companies that have earned 5 years of steadily positive returns are finding themselves in the same situation. While these positive returns have had meaningful impact on achieving our financial goals, we are going to start feeling them in the checks we have to write to the government. 

According to a Morningstar and Lipper study, the average annual tax drag on returns for investors is .92% for owners of U.S. equities.  This means that if you average 10% a year returns in your equities, the amount you put in your pocket is 9.08% after you pay the government its share.  From 1996 to 2000, during the extreme run up of the tech bubble, the average tax drag per year was 2.53%1.  This can happen when there has been no bear market or correction for many years.  We would argue it is happening again now.

4 Tips for Managing Taxes

Perhaps the key at this stage of the game is not to avoid taxes but to take many small steps to manage them.  There are several key steps that we utilize in managing portfolios to also minimize taxes.

1. Asset Location:  Place your least-tax-efficient, highest returning investments in your IRA or 401(k).

2. Loss Harvesting: Continually monitor your taxable accounts for losses to harvest rather than only looking in the last quarter of the year. 

3. Maximize contributions to tax-deferred retirement accounts:  This directly lowers your taxable income when maximizing your contributions to 401(k) plans at work.

4. Harvest gains:  In the long run, taking gains during years your income is lower than normal can potentially reduce the amount of taxes paid to the government over a lifetime.

While paying attention to expenses always seems to top the headlines, taxes are just as big of a drag to long-term investor returns. Consult a tax advisor about your particular tax situation.

Angela Palacios, CFP®is the Portfolio Manager at Center for Financial Planning, Inc. Angela specializes in Investment and Macro economic research. She is a frequent contributor to Money Centered as well asinvestment updates at The Center.

1:Source: http://www.lipperweb.com/docs/aboutus/pressrelease/2002/DOC1118788693610.doc

This material is being provided for information purposes only and is not a complete description, nor is it a recommendation. Any opinions are those of Center for Financial Planning, Inc. and not necessarily those of Raymond James. The information has been obtained from sources considered to be reliable, but Raymond James does not guarantee that the foregoing material is accurate or complete. Raymond James does not provide tax advice. C14-036848

Unrealized Capital Gains? Consider Gifting Stock Instead of Cash

One of the most tax-efficient ways to give a financial gift to your favorite charity is with long-term appreciated securities.  While gifts of cash are easy to make by simply writing a check, don’t overlook the potential benefits of gifting stock that has gone up in value.  By considering both options, you may be able to increase the tax benefit and make the most of your year-end tax planning and gifting goals. 

Here are four tips to consider:

  1. If you own stock investments (held longer than 12 months) with unrealized capital gains, the best way to give may be with a portion of stock rather than an all cash donation.  By gifting stock, you receive a deduction for the market value and reduce future capital gains tax liability.  

  2. If you own stock with short-term gains (owned for less than 12 months) the strategy is not optimal because your tax deduction will be limited to the amount you paid for the shares. 

  3. If you think the gifted stock still has upside potential, you can use the cash you would have otherwise donated to replace the shares of stock you donated.  This will reset the stock cost basis to the current market value, reducing future capital gains tax liability.

  4. If you are holding taxable investments that have lost ground, it may be preferable to sell the investment, claim a capital loss, take the charitable deduction and gift the cash.  In this scenario, the combined tax deductions may make this strategy a winner.

Making the Call between Gifting Cash or Appreciated Stock 

If you are looking to support organizations important to you and maximize your tax benefits, it is important to consult with your tax advisor and include your financial planner to make the most of your tax planning and lifetime gifting goals.  

Laurie Renchik, CFP®, MBA is a Partner and Senior Financial Planner at Center for Financial Planning, Inc. In addition to working with women who are in the midst of a transition (career change, receiving an inheritance, losing a life partner, divorce or remarriage), Laurie works with clients who are planning for retirement. Laurie was named to the 2013 Five Star Wealth Managers list in Detroit Hour magazine, is a member of the Leadership Oakland Alumni Association and in addition to her frequent contributions to Money Centered, she manages and is a frequent contributor to Center Connections at The Center.

Five Star Award is based on advisor being credentialed as an investment advisory representative (IAR), a FINRA registered representative, a CPA or a licensed attorney, including education and professional designations, actively employed in the industry for five years, favorable regulatory and complaint history review, fulfillment of firm review based on internal firm standards, accepting new clients, one- and five-year client retention rates, non-institutional discretionary and/or non-discretionary client assets administered, number of client households served.

This material is being provided for information purposes only and is not a complete description, nor is it a recommendation. Any opinions are those of Center for Financial Planning, Inc. and not necessarily those of Raymond James. C14-036845