Investment Planning

The Importance of Staying Invested

Print Friendly and PDF
The+Importance+of+Staying+Invested

While trying to time the market may seem tempting during times of volatility, investors who attempt to, run the risk of missing periods of quality returns, likely leading to significant adverse effects on the ending value of a portfolio.

The image below illustrates the value of a $100,000 investment in the stock market during the 2007–18 period, which included the global financial crisis and the recovery that followed. The value of the investment dropped to $54,381 by February 2009 (the trough date), following a severe market decline. If an investor remained invested in the stock market over the next nine years, however, the ending value of the investment would have been $227,993. If the same investor exited the market at the bottom, invested in cash for a year, and then reinvested in the market, the ending value of the investment would have been $148,554. An all-cash investment at the bottom of the market would have yielded only $56,122. The continuous stock market investment recovered its initial value over the next three years and provided a higher ending value than the other two strategies. While all recoveries may not yield the same results, investors are well advised to stick with a long-term approach to investing.

The Importance of Staying Invested

Sometimes it can feel very difficult to stay invested!

Crises and Long-Term Performance

Economies and markets tend to move in cycles, and any stock market can have a downturn once in a while. Most investors lose money when the stock market goes down, but some people may think they can time the market and gain. For example, an investor may aim to buy in when the market is at the very bottom and cash out when the recovery is complete, thus enjoying the entire upside.

The problem with this type of reasoning is that it’s impossible to know when the market hits bottom. Most investors panic when the market starts to decline, then they decide to wait and end up selling after they have already lost considerable value. Or, on the recovery side, they buy in after the initial surge in value has passed and miss most of the upward momentum.

The graph illustrates the growth of $1 invested in U.S. large stocks at the beginning of 1970 and the four major market declines that subsequently occurred, including the recent banking and credit crisis. Panic is understandable in times of market turmoil, but investors who flee in such moments may come to regret it.

Each crisis, when it happens, feels like the worst one ever (the most recent one in 2008, as evidenced by the image, actually was). When viewed in isolation on the lower-tier graphs, each decline appears disastrous. However, historical data suggests that holding on through difficult times can pay off in the long run. For example, $1 invested in January 1970 grew to $117.05 by December 2018, generating a 10.2% compound annual return. And in the past, when looking at the big picture, every crisis has been eclipsed by long-term growth.

The Importance of Staying Invested

Please don’t hesitate to reach out to us when you are feeling uneasy during market volatility.  We are here, working for you!

Angela Palacios, CFP®, AIF®, is a partner and Director of Investments at Center for Financial Planning, Inc.® She chairs The Center Investment Committee and pens a quarterly Investment Commentary.


Returns and principal invested in stocks are not guaranteed. Stocks have been more volatile than bonds or cash. Holding a portfolio of securities for the long term does not ensure a profitable outcome and investing in securities always involves risk of loss. About the data: Stocks are represented by the Ibbotson® Large Company Stock Index. An investment cannot be made directly in an index. Four market crises defined as a drop of 25% or more in the index. Return is represented by the compound annual return. Recession data is from the National Bureau of Economic Research. The market is represented by the Ibbotson® Large Company Stock Index. Cash is represented by the 30-day U.S. Treasury bill. An investment cannot be made directly in an index. The data assumes reinvestment of income and does not account for taxes or transaction costs. Performance of a hypothetical investment does not reflect transaction costs, taxes, or returns that any investor actually attained and may not reflect the true costs, including management fees, of an actual portfolio. Changes in any assumption may have a material impact on the hypothetical returns presented. Illustration does not include fees and expenses which would reduce returns. The information contained in this report does not purport to be a complete description of the securities, markets, or developments referred to in this material. The information has been obtained from sources considered to be reliable, but we do not guarantee that the foregoing material is accurate or complete. Any opinions are those of Angela Palacios, and not necessarily those of Raymond James. Expressions of opinion are as of this date and are subject to change without notice. There is no guarantee that these statements, opinions or forecasts provided herein will prove to be correct. Investing involves risk and you may incur a profit or loss regardless of strategy selected. Keep in mind that individuals cannot invest directly in any index, and index performance does not include transaction costs or other fees, which will affect actual investment performance. Individual investor's results will vary. Past performance does not guarantee future results. Any information is not a complete summary or statement of all available data necessary for making an investment decision and does not constitute a recommendation.

The Single Most Important Investing Decision

Nicholas Boguth Contributed by: Nicholas Boguth

Most Important Investing Decision Center for Financial Planning, Inc.®

Unsurprisingly, I think investing is fun. This is one of the reasons I’ve chosen a career in investment management. With that being said, my career is only 6 years in. Is it possible that I only think investing is fun because the stock market has hit a new all‐time high every single year of my career? Do stocks ever fall? Why even own bonds that pay 2% coupons?

With the decade being over, and the S&P 500 rising almost 190% over the prior ten years, it seems like a good time to remind ourselves of a few key investing principles.

  • Stocks are risky. Their prices can fall.

  • Bonds are boring, but they have potential to help preserve your portfolio.

  • Asset allocation is the single most important investing decision you will make.

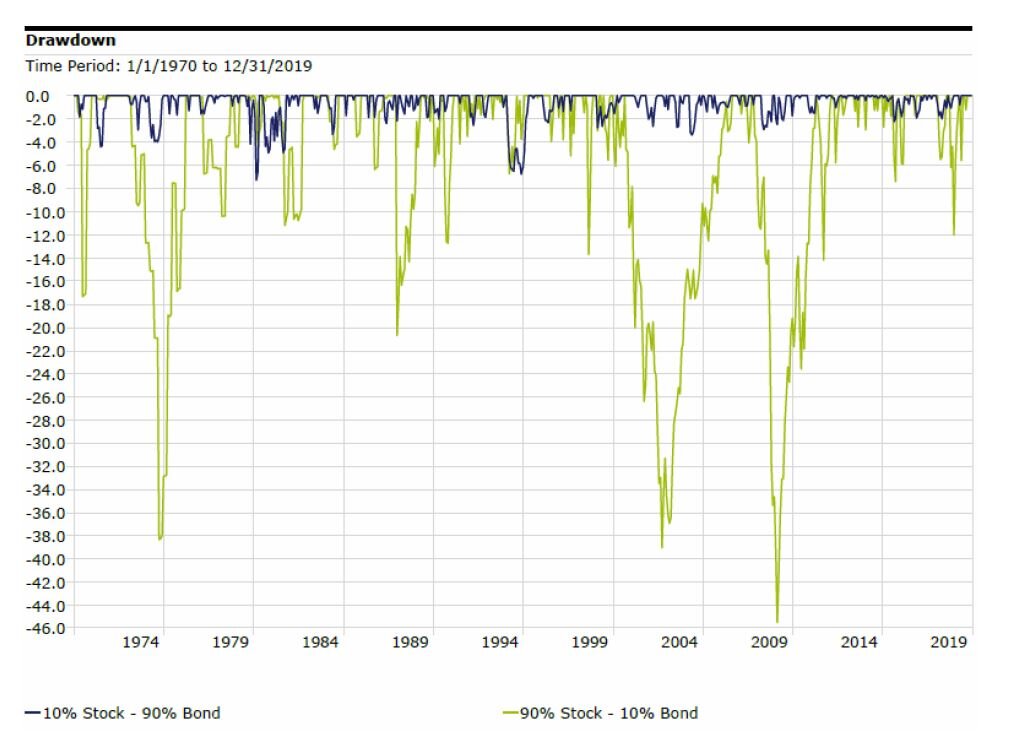
Asset allocation in its simplest form is the ratio of stocks to bonds in your portfolio. More stocks in your portfolio means more risk. More bonds in your portfolio means more potential to balance out the risk of stocks. As financial planners, one of the first decisions we’ll help you make is the decision of what asset allocation is most likely going to lead to your financial success.

Take a look at the drawdowns of a portfolio of mostly stocks (green line) compared to a portfolio of mostly bonds (blue line). Stocks may have roared through the 2010’s, but no one has a crystal ball to tell us what they will do in the 2020’s. This chart is a good reminder of what stocks CAN do. Be sure that your portfolio is set up to maximize your chance of success no matter what stocks do. If you are unsure about your current portfolio, we’re here to help.

Source: Morningstar Direct. Stock index: S&P 500 TR (monthly). Bond Index: IA SBBI US IT Govt Bond TR (monthly).

Source: Morningstar Direct. Stock index: S&P 500 TR (monthly). Bond Index: IA SBBI US IT Govt Bond TR (monthly).

Nicholas Boguth is a Portfolio Administrator at Center for Financial Planning, Inc.® He performs investment research and assists with the management of client portfolios.


Investing involves risk and you may incur a profit or loss regardless of strategy selected, including diversification and asset allocation.

The information has been obtained from sources considered to be reliable, but we do not guarantee that the foregoing material is accurate or complete. The IA SBBI US IT Government Bond Index is an index created by Ibbotson Associates designed to track the total return of intermediate maturity US Treasury debt securities. One cannot invest directly in an index. Past Performance does not guarantee future results.

Investment Commentary: Fourth Quarter 2019

Center for Financial Planning, Inc.® Investment Commentary Fourth Quarter 2019

It’s a new decade, and there is much to discuss! We’d love to see you at our annual Economic and Investment Outlook event, happening Wednesday, February 5, from 11:30 a.m. to 1 p.m. We’ll review the past year and take a look at what to expect in 2020. Lunch will be provided. You can register here. If you are unable to attend, don’t worry! We’ll send a link to view the presentation afterward.

2019 in Review

Where’s the beef? 2019 will be remembered as the year of the meat alternative. Burger King introduced the “Impossible Whopper”. Fans raved that this meatless alternative tastes great (I’ll take their word for it). However, investors were not left wondering about the beef in the markets, as 2019 saw excellent returns for both bonds and stocks. 2019 was strong until early May, rallying from a 2018 Christmas Eve low over 25%. The old adage “sell in May and go away” would have worked for investors this year. Point-to-point, from early May to early October, the S&P 500 was down just under 2%. From October on, however, the markets rallied strongly through year-end. Here’s how they finished up for the year:

 
Center for Financial Planning, Inc.® Investments 2019 Market Returns
 

What spurred this strong rally?

The Federal Reserve Board (the Fed)

Interest rates were cut three times throughout 2019, with guidance from the Fed that future rate hikes were very unlikely, while inflation remained low. This was a complete turnaround from the Fed, increasing rates four times in 2018 to the point that the yield curve briefly inverted in early 2019. (The yield curve shows what interest bonds of the same credit quality with different maturity dates pay.) This meant that the yield on a 2-year U.S. Treasury bond was paying more interest than a 10-year Treasury bond. Since then, the yield curve has rapidly steepened as short-term interest rates moved back down. Cutting rates not only spurred bonds to a record year, but also provided a tailwind that lifted stock markets to higher levels. Remember the old saying “Don’t fight the Fed”? This means that when the Fed is reducing interest rates, markets tend to go up, and this year was no exception.

Trade wars

Markets have responded very favorably to the trade war de-escalation. China and the U.S agreed to the phase-one trade deal in December, removing significant unpredictability, at least in the near term. This agreement rolls back a portion of the existing tariffs and cancels the tariffs that were to be implemented on December 15, 2019. China also has committed to purchasing more agricultural products, goods, and services from the U.S. in the coming years. However, significant work remains to resolve the larger sticking points in the trade war. This will likely be a factor influencing market performance and volatility in the coming year.

Corporate Buybacks

Over the course of the business cycle, the contribution to equity returns from corporate share buybacks ebbs and flows. Companies frequently buy back their own shares with the firm’s profits. This will increase Earnings Per Share (EPS), because the company’s earnings are divided among fewer shares, and it becomes a way to potentially increase stock prices.

Post-recession, companies tend to have less expendable cash and tend to buy back fewer shares. Later in the business cycle, they become cash rich and are able to more heavily deploy funds. This business cycle is no exception. Share buybacks throughout 2018 and 2019 have been a contributor to growth in EPS for companies. The one time allowance of corporate funds repatriation at a lower tax rate (allowed by Trump’s tax reform) has, no doubt, boosted this a bit.

The chart below shows the growing percentage of share buy backs. Twenty-eight percent of corporate cash on hand was utilized for this in 2018 and 2019, versus only 21% in 2010. Also notable, is the growing pool of cash (total height of the bar each year) for S&P 500 companies.

 
Source: Bloomberg, Compustat, FactSet, Standard & Poor’s, J.P. Morgan Asset Management

Source: Bloomberg, Compustat, FactSet, Standard & Poor’s, J.P. Morgan Asset Management


Impeachment threatened to derail the 2019 stock market rally

The House of Representatives formally voted to Impeach President Trump in December, which the markets largely anticipated. Now, the House is preparing to send the Articles of Impeachment to the Senate and begin trial there. The Republican-controlled Senate is expected to acquit President Trump. If the vote goes as expected, it should not have an impact on markets. I see this as the most likely scenario.

What do we expect for 2020?

Election year

As 2020 ramps up, so will the political campaigns. The chart below looks at the S&P 500 performance during election years. The story is largely one of positive returns. In previous years, 6- and 12-month returns ahead of a presidential election have been positive almost 90% of the time.

Center for Financial Planning, Inc.® Investment Commentary Fourth Quarter 2019

Our economic indicators support moderate growth, and markets are playing out in a positive manner, but we are watching a few points of worry.

U.S.-Iran tensions increase

The markets took a hit during the first week of January, after a move by President Trump. In response to Iran’s latest threat, Trump targeted Iran’s top general Qasem Soleimani, ultimately killing him in a U.S. air strike. This marks a departure from the nonmilitary approach the president has taken with the rest of the world, and caused the markets to quickly pull back. We’ll be watching the escalation of this geopolitical risk. 

After studying markets during other overseas military conflicts, we see the stock market flare up at the beginning of each conflict, when uncertainty is at its greatest. Once a course of action is decided, markets tend to settle into a general growth pattern, if the overall economy remains strong. This holds true even if that action is U.S. military invasion, which may seem counter intuitive. During this tension, many investors chose bonds as their safe haven. Oil is expected to spike and put some upward pressure on inflation. However, the amount of oil we can supply ourselves could mute this impact.

Economic Highlights:

  • Unemployment remains at 50 year lows at 3.5%.

  • Inflation, as measured by the PCE Price Index, rose 1.6% over the year ending November 2019.

  • Gross Domestic Product (GDP) rose 2.1% in the third quarter, exceeding expectations.

  • Retail sales increased 3.3% year over year, with online sales leading the growth – signs of a healthy consumer.

  • U.S. dollar strength continues, bolstered by low inflation and low interest rates.

Economic Lowlights:

  • ISM Manufacturing Index declines to 48.1. Any reading below 50 indicates contraction and is a potential recessionary signal.

  • Consumer Confidence Index softens from reaching all-time highs, leaving us to wonder whether the consumer will continue to buy goods and services at the same pace (which boosts GDP).

  • While leading indicators softened in the fall, the most recent reading leveled off. A negative trend here can signal a coming recession, but this softening hasn’t yet pushed us into the camp of calling for recession.

2019 was a strong year for U.S. markets. We predict positive returns will continue, just not at the same pace we experienced last year. At this point, we don’t expect a recession this year, but companies will likely face challenges as the Trade War continues. The 2020 election will continue to be on our minds as a party change in the White House could bring new economic policies.

As we welcome the New Year, we don’t want to miss the opportunity to express our gratitude for the trust you place in us each and every day. Thank you! Have a wonderful 2020!

On behalf of everyone here at The Center,

Angela Palacios, CFP®, AIF®
Partner & Director of Investments

Angela Palacios, CFP®, AIF®, is a partner and Director of Investments at Center for Financial Planning, Inc.® She chairs The Center Investment Committee and pens a quarterly Investment Commentary.


There is no guarantee that these statements, opinions or forecasts provided herein will prove to be correct. Past Performance does not guarantee future results.

One cannot invest directly in an index. The S&P 500 is an unmanaged index of 500 widely held stocks that is generally considered representative of the U.S. stock market. The MSCI EAFE (Europe, Australasia, and Far East) is a free float-adjusted market capitalization index that is designed to measure developed market equity performance, excluding the United States & Canada. The EAFE consists of the country indices of 22 developed nations. The Russell 2000 Index measures the performance of the 2,000 smallest companies in the Russell 3000 Index, which represent approximately 8% of the total market capitalization of the Russell 3000 Index. The Bloomberg Barclays US Aggregate Bond Index is a broad-based flagship benchmark that measures the investment grade, US dollar-denominated, fixed-rate taxable bond market.

The information has been obtained from sources considered to be reliable, but we do not guarantee that the foregoing material is accurate or complete.

Great Expectations

Nicholas Boguth Contributed by: Nicholas Boguth

Great Expectations Center for Financial Planning, Inc.®

We hear a lot about how stocks perform “on average”, and what to “expect” from stock returns:

  • “On average, stocks return x%.”

  • “You can expect stocks to return x% over the long run.”

  • “We expect stocks to return x% per year.”

But what to expect and what is average are two very different things. In fact, average happens so rarely, that I would almost never expect the average. Let’s take a look at some numbers.

Below is a chart of one-year rolling returns for the S&P 500 since 1936. Every spot on that line represents the prior 12 months of returns. As you can see, it is quite sporadic. The “average” return for this set of data is +11.9%, but it ranges from -50% to more than +61%!

Return data from Morningstar Direct

Return data from Morningstar Direct

When it comes to investing, realistic expectations are very important.

They keep us grounded and help us keep emotions out of the decision-making process. Don’t expect average returns every time you look at your stocks. Statistically speaking, since two standard deviations capture ~95% of data, it is safe to say you can expect somewhere between two standard deviations on any given period. If you are looking at one-year returns, that would be between -23% and +47%.

It is also important to remember your time horizon. Expectations over one year should be very different than expectations over 30 years. For reference, the entire range of 30-year returns for the S&P 500 since 1936 is between +9.1% and +14.7%.

S&P 500 TR index, monthly returns, 3/31/1936 to 10/31/2019

S&P 500 TR index, monthly returns, 3/31/1936 to 10/31/2019

Lastly, we need to remember that this is only one asset class. If you have a diversified strategy, there is a good chance that large U.S. companies only make up a small percentage of your strategy. International companies, small and mid-sized companies, various bonds, and alternative strategies all merit different expectations. As financial advisors, it is our job to help you understand what to expect. Not sure what to expect? Give us a call.

Nicholas Boguth is an Investment Research Associate at Center for Financial Planning, Inc.® He performs investment research and assists with the management of client portfolios.


Return data from Morningstar Direct. S&P 500 TR index, monthly returns, 3/31/1936 to 10/31/2019. Any opinions are those of Nicholas Boguth, Investment Research Associate, and not necessarily those of Raymond James. Expressions of opinion are as of this date and are subject to change without notice. There is no guarantee that these statements, opinions or forecasts provided herein will prove to be correct. Investing involves risk and you may incur a profit or loss regardless of strategy selected, including diversification and asset allocation. Keep in mind that individuals cannot invest directly in any index, and index performance does not include transaction costs or other fees, which will affect actual investment performance. Individual investor's results will vary. Past performance does not guarantee future results. Future investment performance cannot be guaranteed, investment yields will fluctuate with market conditions. The S&P 500 is an unmanaged index of 500 widely held stocks that is generally considered representative of the U.S. stock market. International investing involves special risks, including currency fluctuations, differing financial accounting standards, and possible political and economic volatility.

Capital Gains Distributions from Mutual Funds

Kali Hassinger Contributed by: Kali Hassinger, CFP®

Capital Gains Distributions from Mutual Funds

Each November and December, investment companies must pay out their capital gains distributions for the year. If you hold these funds within a taxable brokerage account, distributions are taxable events, resulting from the sale of securities throughout the year.

Investors often meet these pay-outs with minimal enthusiasm, however, because there is no immediate economic gain from the distributions. That may seem counterintuitive, given that we refer to these distributions as capital gains! 

When capital gains distributions from mutual funds are paid to investors, that fund’s net asset value is reduced by the amount of the distribution.

This reduction occurs because the fund share price, or net asset value, is calculated by determining the total value of all stocks, bonds, and cash held in the fund’s portfolio, and then dividing the total by the number of outstanding shares. The total value of the portfolio is reduced after a distribution, so the price of the fund drops by the amount of the distribution.

In most situations we recommend that our clients reinvest mutual fund capital gain distributions,  given this is right for the investor's individual financial circumstances. 

This strategy allows you to purchase additional shares of the mutual fund while the price is reduced. Although your account value will not change, because the distribution reduces the fund’s net asset value, you have more shares in the future. By incurring the capital gain, you are also increasing your cost basis in the investment. 

As a counter point, If you rely on the dividend for income it might make more sense to take the mutual fund dividend as cash and not reinvest.

If you own mutual funds in a taxable account and expect the distributions to be large, you should work with your financial planner and tax advisor to weigh the advantages and disadvantages of owning the investment and ultimately incurring the capital gain.

Kali Hassinger, CFP®, CDFA®, is a CERTIFIED FINANCIAL PLANNER™ professional at Center for Financial Planning, Inc.® She has more than a decade of financial planning and insurance industry experience.


The information contained in this blog does not purport to be a complete description of the securities, markets, or developments referred to in this material. Investments mentioned may not be suitable for all investors. There is no guarantee that these statements, opinions or forecasts provided herein will prove to be correct. Past performance may not be indicative of future results. Raymond James and its advisors do not provide tax advice. You should discuss any tax matters with the appropriate professional. Opinions expressed in the attached article are those of the author and are not necessarily those of Raymond James. All opinions are as of this date and are subject to change without notice. Investing involves risk and you may incur a profit or loss regardless of strategy selected. Prior to making an investment decision, please consult with your financial advisor about your individual situation. Every type of investment, including mutual funds, involves risk. Risk refers to the possibility that you will lose money (both principal and any earnings) or fail to make money on an investment. Changing market conditions can create fluctuations in the value of a mutual fund investment. In addition, there are fees and expenses associated with investing in mutual funds that do not usually occur when purchasing individual securities directly.

Trade War Winners and Losers

Jaclyn Jackson Contributed by: Jaclyn Jackson

Trade War Winners and Losers

Emboldened by NAFTA trade deal renegotiations with Mexico and Canada, car import taxation, and the U.S.-China trade war, protectionism is at the forefront of U.S. economic policy. As the world spotlight focuses on the U.S.-China trade war, many are watching to see how the battle between two of the largest world economies will play out, and how it will affect global economic interdependence.

For those keeping score, trade war winners and losers are as follows:

Winners

  • Cheap Exporters (Vietnam, Taiwan, South Korea, Japan) - Companies have opted to move distribution from China to Vietnam in attempt to bypass U.S. tariffs. As of August 2019, the U.S. imports 40% more from Vietnam than it did in 2018. Cheap exporters win with more opportunities to improve their gross domestic product (GDP). In the case of Vietnam, exports to the U.S. are 26% of their 2019 GDP.

  • Brazil - China imports 60% of soybeans traded worldwide. After Beijing issued a retaliatory 25% duty on U.S. imports, Brazil exported two million additional metric tons of soybeans to China between October and November of 2018.

  • Manufacturing Sector - Fabricated metals, machinery, and electronic instrument industries doubled jobs from 15,000 to 30,000 between May 2018 and May 2019. Not to mention, of the 2.6 million new jobs added since tariff announcements, 204,000 of them were in the manufacturing sector.

Losers

  • Consumers - Americans may feel the pain in their wallets, with increased prices of products impacted by the trade war.

  • European Union - Opposite cheap exporters, the European Union (EU) is at risk of worsened gross domestic product. Currently, exports create 40% of GDP. Twelve percent of that GDP is generated from the United States. As the EU’s largest exporter and economy, Germany is at risk of being hit hardest.

Perspective Matters

Keep in mind that viewing the trade war through the lens of winners and losers is an oversimplification. The economic interconnectedness of globalization is quite complex. It’s no wonder many are scratching their heads when considering whether protectionist policies are helpful or harmful.

Also, the data tells conflicting stories. Case in point: the manufacturing industry. As explained above, the industry is experiencing domestic job growth, which would point to a benefit of protectionism. For balance, according to the Bureau of Labor Statistics, only six of the 20 major manufacturing categories have grown faster since tariff threats began. The other 14 have been either consistent or done worse. Notably, textile, paper, and chemical industries slumped, because of steel or softwood lumber tariff retaliation. Vehicle, technology, heavy equipment, and agriculture companies have suffered a similar fate. What’s more, some industries have cut jobs because of rising production costs from tariffs. General Motors, for example, lost $1 billion in 2018 and projects additional costs of the same amount this year. As a result, they’ve closed plants, subsequently fueling a strike by 46,000 employees. The pain doesn’t stop there; GM’s major suppliers have also lost vital business.

Opportunity Knocks

No doubt, international equities have taken one on the chin, and protectionist policies have not helped. In fact, international markets have underperformed the S&P 500 over the last seven years. However, if we zoom out a bit, historically low international valuations may indicate an entry point for long-term investors. The diagram below reflects less than average valuations for developed markets, Europe, Japan, and emerging markets. While trade war headlines impact emerging markets most, valuations urge investors to review these spaces further for investing potential.

 
Source: FactSet, MSCI, Standard & Poor’s, Thomson Reubers, J.P. Morgan Asset Management.

Source: FactSet, MSCI, Standard & Poor’s, Thomson Reubers, J.P. Morgan Asset Management.


Additionally, looking at when international stocks have outperformed U.S. stocks between 1975 and 2015, we see a pattern; international and U.S. equity performance is generally cyclical. The data indicates that as the cyclical nature between U.S. stocks and international stocks shifts in favor of international stocks, long-term investors have a chance to recover the difference between current valuations and 25-year historical averages. It also punctuates the importance of portfolio diversification.

 
Chart: MSCI EAFE Index vs. S&P 500 Total Return Index. Source: FactSet, as of 12/31/15.

Chart: MSCI EAFE Index vs. S&P 500 Total Return Index. Source: FactSet, as of 12/31/15.


While it is unclear how protectionist policies will play out, and who will win or lose as a result, long-term trends must be considered. More importantly, investors must ask themselves whether protectionism will indefinitely deter international markets, or just force them to adapt and reimagine how world markets interact.

Jaclyn Jackson is a Portfolio Administrator at Center for Financial Planning, Inc.® She manages client portfolios and performs investment research.


The information contained in this report does not purport to be a complete description of the securities, markets, or developments referred to in this material. The information has been obtained from sources considered to be reliable, but we do not guarantee that the foregoing material is accurate or complete. Any opinions are those of Jaclyn Jackson and not necessarily those of Raymond James. Expressions of opinion are as of this date and are subject to change without notice. There is no guarantee that these statements, opinions or forecasts provided herein will prove to be correct. Investing involves risk and you may incur a profit or loss regardless of strategy selected. Keep in mind that individuals cannot invest directly in any index, and index performance does not include transaction costs or other fees, which will affect actual investment performance. Individual investor's results will vary. Past performance does not guarantee future results. Future investment performance cannot be guaranteed, investment yields will fluctuate with market conditions. International investing involves special risks, including currency fluctuations, differing financial accounting standards, and possible political and economic volatility.
Investing in emerging markets can be riskier than investing in well-established foreign markets. Investing involves risk and investors may incur a profit or a loss.
Investing in commodities is generally considered speculative because of the significant potential for investment loss. Their markets are likely to be volatile and there may be sharp price fluctuations even during periods when prices overall are rising.

Third Quarter Investment Commentary

Investment Commentary Third Quarter Center for Financial Planning, Inc.®

As we enjoy fall, and the kids are excited for Halloween, the end of the year is right around the corner! Here is a summary of what occurred in markets over the past quarter, and what we think may come before year-end.

Executive Summary

  1. It has been a strong quarter for U.S. equities, and the odds seem to be in our favor for this to continue, but a slowing economy and the trade war could, at any moment, derail growth.

  2. Bond markets have offered a haven to the increased market volatility, and they have experienced above-average returns as the Federal Reserve (the Fed) has begun lowering rates this year. As markets have marched on, we have rebalanced and increased duration within bonds to more strongly offset market volatility (this area tends to zig when the markets zag).

  3. Investors have been overly punitive to international markets.

  4. Economic indicators continue to soften.

  5. With impeachment possible, headlines will contribute to volatility, but conviction/removal of President Trump remains unlikely as this requires a two-thirds vote in the Senate.

  6. At these historically low-interest rates, federal debt is now far more affordable to service than it was 20 years ago.

  7. Remember that our portal offers a current view of your asset allocation and returns, and offers a vault to securely transfer documents to us! Also, search for us in the App Store under “Center for Financial Planning” for smartphone access to the portal.

U.S. Equity Markets

Historically, the third quarter of the year is the most difficult for the S&P 500. This is where the old saying, “Sell in May and Go Away” comes from.  Despite the increased volatility, the S&P 500 managed to make it through on a positive note, with the S&P 500 up 1.7%. For the year so far, the S&P 500 has been up a whopping 20.55%, far exceeding what most experts were calling for this year. With the markets up so much already this year, you may wonder, “Will they run out of steam?”.  A slowing economy and the trade war with China hold the potential to derail or boost returns on any given day, depending on how negotiations are going.

Interest rates

The clear winner for the quarter was bonds, as the increased volatility in U.S. equities sent investors into a more secure investment strategy, boosting the Bloomberg Barclays US Aggregate Bond Index 2.27%. So far for the year, this index is up 8.52% as the Federal Reserve has completely reversed course from tightening monetary policy (raising interest rates) to loosening monetary policy (lowering interest rates).

Interest rate activity was at the forefront of the headlines for the quarter, especially in September. During the month, eight of the top 10 developed market central banks met to discuss interest rates. The ECB (European Central Bank) and the Federal Reserve here in the U.S. were the only two to reduce target policy rates, but several others are discussing rate cuts in the months ahead. Meanwhile, here in the U.S., policymakers are projecting a third rate cut this year. We believe this will be very dependent on developments in trade talks with China, market returns, as well as the growth outlook globally and here in the U.S.

Meanwhile, a large portion of the world’s sovereign debt has negative yields making our treasury rates still very attractive to buyers overseas. This also is pressuring rates downward. As markets have continued to climb, we have been rebalancing here and increasing duration within bonds to offset market volatility more strongly (higher duration bonds tend to perform more positively than short duration bonds during a stock market retreat).

International Equities

International markets have lagged U.S. markets again during this quarter. The MSCI EAFE Index was down 1.07% while year to date is up 12.8%. So, the disparity between international and U.S. returns continued to grow during the quarter. Much of this is due to stronger economic growth in the U.S. versus overseas. Brexit, trade wars, and a strong U.S. dollar also continue to plague international returns.

Indicators

Our economic indicators continue to soften. While slightly above half are still looking positive, a few are flashing red, and positive indicators continue to become less positive or grow at a slower rate. The manufacturing index is one area teetering on the brink of contraction, giving the lowest reading in 10 years, but technically still giving a positive signal. Here are some others:

20191015a.jpg

Impeachment

The House of Representatives is once again gearing up to attempt impeachment proceedings. Impeachment is the process whereby the House of Representatives, through a simple majority vote, brings charges against a government official. After the government official is impeached, the process then moves to the Senate to try the accused. The Senate must pass its vote by a two-thirds majority. (Note: Republicans hold 53 seats, while Democrats hold 47.) If this happened, President Trump would be removed from the office, and the Vice President would take his place.

There is little in recent history to help us understand how markets would react here in the U.S. if this were to happen. Bill Clinton was impeached in 1998, and Richard Nixon resigned during his Impeachment proceedings, but was never actually impeached. Several unsuccessful attempts have been made to impeach Donald Trump, George W. Bush, and, yes, even Barack Obama. When Bill Clinton was impeached, markets were down in bear market territory (over 20% peak to trough on the S&P 500) for a short time before they rallied back. The Russian Ruble Crisis also occurred at the same time, so it is hard to say whether the impact to markets was solely due to the impeachment process.

While removal of the President seems unlikely, short-term volatility would probably occur during any period of uncertainty. This is one of the many reasons we maintain a diversified portfolio. If stocks retreat, our bond portfolios would likely perform well, and international investments may strengthen in the face of a weaker dollar. A diversified portfolio, with cash or cash equivalents set aside for short-term needs, is the most effective solution to an extremely rare event like this.

Federal Debt

We are often asked about this topic; it seems to be an ever-present concern. While attending a conference in late September, I listened to Blackstone’s Byron Wien, a 60-year veteran of the markets. He put some very long-term perspective around the Federal debt levels and interest rates. He has been hearing “we can’t pass this along to our grandchildren” for the entire 60 years he has been in the business. He won’t go so far as to say the ratio of debt to GDP doesn’t matter, but believes we must put it into perspective.

According to Byron, today, the combined debt of the U.S is $22 trillion, up almost four times from 20 years ago, when it stood at about $6 trillion. However, the blended interest rate the government pays to service this debt is only up about 25% over what the government paid 20 years ago. It now costs $430 billion annually to service debt at current interest rates. This blends out to be just a bit over 2%; whereas, 20 years ago, it cost about $360 billion to service debt at a blended interest rate of a little over 6%. In summary, it is only 25% more costly to service our debt than it was 20 years ago, even though the amount of debt has quadrupled. Wien said these low-interest rates are “an economic gift from God.”

Are you curious about how your asset allocation looks? Are you using our new client portal? Did you know this is a secure way to move documents back and forth and that our contact information is at your fingertips? If you are already using the portal and want a primer on how to navigate or a link to login, check out the new instructional video on our website’s Client Login page. If you aren’t using the login, and you are interested, please reach out so we can send you the link to activate it!

On behalf of everyone here at The Center, we hope you enjoy the end of the year and the many holidays to come!

Angela Palacios CFP®, AIF®
Partner
Director of Investments

Angela Palacios, CFP®, AIF®, is a partner and Director of Investments at Center for Financial Planning, Inc.® She chairs The Center Investment Committee and pens a quarterly Investment Commentary.


Source of return data: Morningstar Direct The information contained in this report does not purport to be a complete description of the securities, markets, or developments referred to in this material. The information has been obtained from sources considered to be reliable, but we do not guarantee that the foregoing material is accurate or complete. Any opinions are those of Angela Palacios and not necessarily those of Raymond James. Expressions of opinion are as of this date and are subject to change without notice. There is no guarantee that these statements, opinions or forecasts provided herein will prove to be correct. Investing involves risk and you may incur a profit or loss regardless of strategy selected. Keep in mind that individuals cannot invest directly in any index, and index performance does not include transaction costs or other fees, which will affect actual investment performance. Individual investor's results will vary. Past performance does not guarantee future results. Future investment performance cannot be guaranteed, investment yields will fluctuate with market conditions. The S&P 500 is an unmanaged index of 500 widely held stocks that is generally considered representative of the U.S. stock market.

Even the Best Investors Lose Money

Nicholas Boguth Contributed by: Nicholas Boguth

Even the Best Investors Lose Money

In an ideal financial planning universe, we would only invest in things that go up. We would never see our account values go down. We would never even see a negative number on our statements. Bonds would pay interest, and interest rates would be so stable that bond prices didn’t move. Stocks would pay dividends, and every company’s earnings would only grow.

Unfortunately for us, investing is not that simple. There is no growth without risk. Nothing, and I mean NOTHING, is guaranteed to appreciate. Even the world’s best investors lose money from time to time, but what makes them the best investors is how they react when those losses happen.

Let’s take a look at Warren Buffett, one of the most successful investors of all time, and how his stock has done compared to the S&P 500 (a collection of the 500 largest public U.S. companies) over the past 25 years. Is it all positive? Does he beat the S&P 500 every year? If he did lose to the S&P 500, was it close? Would you stick with him for the following year?

Data: Morningstar Direct. Total Return.

Data: Morningstar Direct. Total Return.

What stands out to you? Two things jumped out at me:

  1. Both were negative five out of the past 25 years.
    Even one of the best investors in the world lost money the SAME number of times as the S&P 500.

  2. Buffett returned less than the S&P 500 nine times, and one of those times was by more than 40%!
    If you looked at your statement and saw that your $10,000 turned into $8,000, while everyone who owned just the 500 biggest U.S. companies now had $12,000, would you stick with Buffett or would you switch investments?

Investing is hard because of risk. Investments depreciate or underperform for years at a time. You can’t avoid this fact. One thing you can avoid is making decisions that ultimately may be harmful to your goals, by having a plan in place for those years when investments aren’t going the way you’d like.

Don’t have a plan? We would be glad to help.

Nicholas Boguth is an Investment Research Associate at Center for Financial Planning, Inc.® He performs investment research and assists with the management of client portfolios.


Any opinions are those of Nicholas Boguth and not necessarily those of Raymond James. This material is being provided for illustration purposes only and is not a complete description, nor is it a recommendation of any investment mentioned. There is no guarantee that these statements, opinions or forecasts provided herein will prove to be correct. Investing involves risk and you may incur a profit or a loss regardless of strategy selected. Prior to making an investment decision, please consult with your financial advisor about your individual situation. The S&P 500 index is comprised of approximately 500 widely held stocks that is generally considered representative of the U.S. stock market. It is unmanaged and cannot be invested into directly. Past performance is no guarantee of future results.

Climate Change and What It Means for Investors

Jaclyn Jackson Contributed by: Jaclyn Jackson

Climate Change and What it Means for Investors

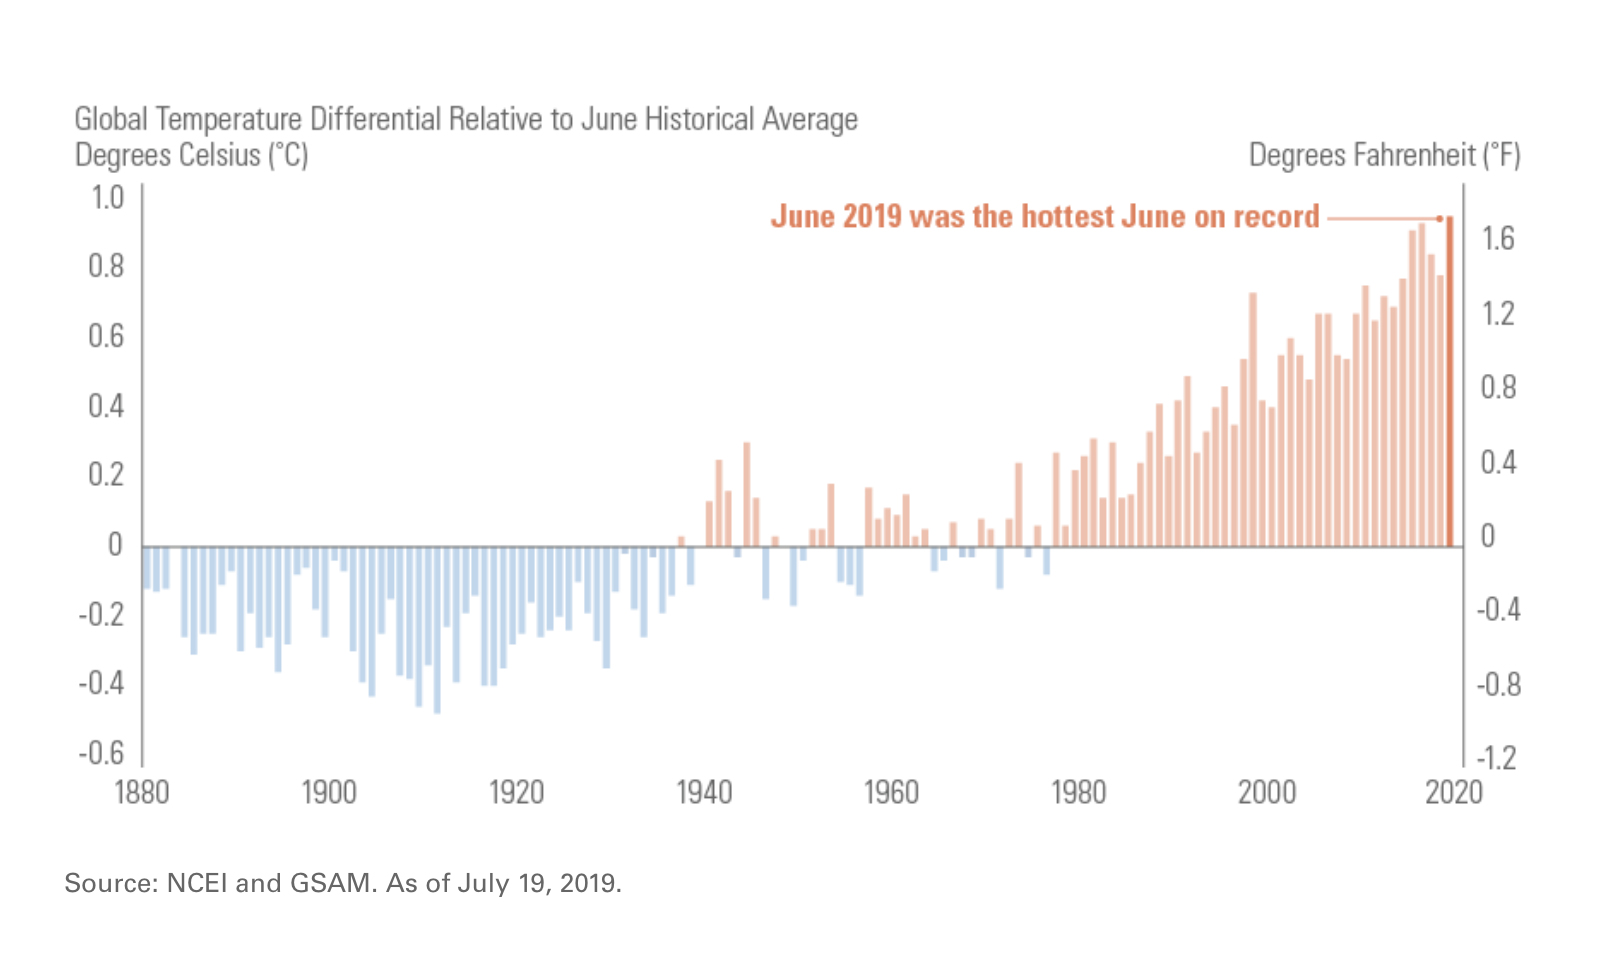
Coming in 1.71°F above its historical average of 59.9°F, June 2019 was the hottest June globally in 140 years of recorded data. June’s temperature increase is the latest in an upward trend that began in the 1970s. While debates hotter than any June persist about the validity of global warming, the fact remains that climate change carries significant implications for individuals, industries, and investors alike.

Global Temperature Differential Relative to June Historical Average

Industry and Economic Impact

Not convinced Mother Nature can wreak havoc on your day-to-day life? Just ask any New Yorker who recently experienced a heatwave, flooding, and power outages all in the same week. In fact, there’s no need to look that far; as of this writing, some Detroiters are still hoping to regain power after incredibly warm weather hit the region.

While it’s pretty clear how extreme weather conditions generate problems for energy companies, heatwaves can disrupt other industries. Manufacturing plants experience reduced production when temperatures soar above 90 degrees; fewer people look for homes, which affects the real estate industry’s most active season; and increased hospitalizations impact insurance companies. While these problems more directly speak to developed, urban areas and industries, they don’t even begin to define the potential implications of climate change around the globe.

Goldman Sachs summarized it best: “We believe that in addition to environmental impact, direct damage from mortality, labor productivity, agriculture, energy demand, and coastal storms may also significantly impact overall economic growth.”

Investors Demand More

It’s no wonder 477 global investors (including money managers and large pension funds around the world) issued a letter to governments attending the G-20 summit in Osaka, Japan. Commanding $34 trillion in assets, they’ve concluded that ignoring the Paris Agreement’s mission would create “an unacceptably high temperature increase that would cause substantial negative economic impacts.” Investors created the letter to petition government leaders to achieve the 2015 Paris Agreement goals, accelerate private sector investment into low carbon transition, and commit to improved climate-related financial reporting.

Be the Change

These investors also use their substantial financial weight to speak with companies in their portfolios about how they are addressing and alleviating industry-specific climate change issues. Individual investors can take a similar approach, by using their financial power to invest in mutual/exchange traded funds that evaluate the environmental, social, and governance (ESG) qualities of companies in their portfolios, as well as more traditional methods of research.

Are you ready to be the change?

Learn more about The Center’s Social Portfolio and ESG investing here.

Jaclyn Jackson is a Portfolio Administrator at Center for Financial Planning, Inc.® She manages client portfolios and performs investment research.


Investors should carefully consider the investment objectives, risks, charges and expenses of Mutual Funds and Exchange-Traded Funds (ETFs) before investing. The prospectus and summary prospectus contains this and other information about Mutual Funds and ETFs. The prospectus and summary prospectus is available from your financial advisor and should be read carefully before investing.

Opinions expressed are those of the author and are not necessarily those of Raymond James. All opinions are as of this date and are subject to change without notice. The information contained in this blog does not purport to be a complete description of the securities, markets, or developments referred to in this material. The information has been obtained from sources considered to be reliable, but we do not guarantee that the foregoing material is accurate or complete. Investing involves risk and investors may incur a profit or a loss regardless of strategy selected. Prior to making an investment decision, please consult with your financial advisor about your individual situation.

SOURCES: https://www.pionline.com/esg/investor-group-pleads-g-20-global-warming https://theinvestoragenda.org/wp-content/uploads/2019/06/FINAL-at-June-24-Global-Investor-Statement-to-Governments-on-Climate-Change-26.06.19-1.pdf

Women’s Leadership as an Investment Concept

Center for Financial Planning, Inc.® Women's Leadership

REPOST

Did you know three of the five partners at The Center are women? We live the value of gender diversity in the ownership and leadership of our firm.

Women’s leadership can and should also be understood as an investment concept.

Many studies have shown that women bring a unique perspective to senior and executive management roles within firms. This “secret ingredient” adds profitability, better risk preparedness, more collaboration, and more innovation to companies. 

An emerging consensus recognizes that the status and roles of women may be an excellent clue to a company’s growth potential.

Despite this, a large wage gap persists between women and equivalent men in the workforce, and there’s very little gender diversity among senior management and corporate boards.

Many barriers affect female participation in management and the boardroom.

One of the most easily understood is time out of the workforce.

Women spend an average 12.6 years out of the workforce to care for children or parents, whereas men only spend an average of 10 months outside the workforce!

This pull between work and family responsibilities likely has a lot to do with the disparities that still exist. After reading Lean In by Sheryl Sandberg, COO of Facebook, I discovered that barriers within ourselves also prevent women from climbing the corporate ladder. There are days when I long to be able to spend more time at home with my daughter, but I also recognize the importance of being the role model of a woman who is happy and successful in her career, as well as enjoying quality family time. My daughter also gains the benefit of seeing a father who is very engaged and shares the responsibilities of parenting, who is a real partner to me. This rhythm works for us. Finding your family’s own rhythm and peace is of utmost importance.

Sharing ideas and our own experiences is part of the solution. Another potential solution is using your investments to express your viewpoint with your dollars. If you would like to learn more, please contact your financial planner!

Angela Palacios, CFP®, AIF®, is a partner and Director of Investments at Center for Financial Planning, Inc.® She chairs The Center Investment Committee and pens a quarterly Investment Commentary.


Any opinions are those of Angela Palacios, CFP®, AIF® and not necessarily those of Raymond James. Expressions of opinion are as of this date and are subject to change without notice. The information has been obtained from sources considered to be reliable, but Raymond James does not guarantee that the foregoing material is accurate or complete. Raymond James is not affiliated with and does not endorse the opinions or services of Sheryl Sandberg or Facebook. This material is being provided for information purposes only and is not a complete description, nor is it a recommendation. This information is not intended as a solicitation or an offer to buy or sell any security referred to herein. Past performance is not a guarantee of future results. Investing involves risk and investors may incur a profit or a loss regardless of strategy selected. Certified Financial Planner Board of Standards Inc. owns the certification marks CFP®, CERTIFIED FINANCIAL PLANNER™, CFP® (with plaque design) and CFP® (with flame design) in the U.S., which it awards to individuals who successfully complete CFP Board's initial and ongoing certification requirements.