Bonds

March FOMC Meeting: Rate Liftoff

Print Friendly and PDF

“The best-laid plans of mice and men often go awry” is a nice way of saying bond market experts had beautifully laid out projections of interest rate increases for the rest of this year, but those projections have quite possibly been turned on their heads now that they are exposed to reality. However, the Federal Reserve (the Fed) began the potential upward march in interest rates with a .25% increase this month. 

Remember from my writing last year, the Fed increases interest rates in an effort to temper inflation. Recent events in Russia put the Fed in a difficult position because they feel pressured to move away from their ultra-accommodative policy. However, the longer the Russia/Ukraine conflict persists, the more unlikely it is that the US economy will be unscathed, as we are seeing with energy prices right now. Raising interest rates will not combat inflation caused by a spike in energy prices nearly as easily (not that it was easy before). It may even risk pushing the economy into a stagflationary environment (a period of low economic growth with high inflation).

The bonds markets have accounted for a large amount of these rate increases already (pricing six 0.25% rate increases in 2022, giving a 50% change of a .5% rate increase occurring at the next meeting in May). However, we are still seeing rates jitter up and down as bond markets try to digest rate liftoff coupled with inflation and the Russia/Ukraine crisis.

So while Chairman Powell is still standing firm that they will utilize increasing interest rates (approximately six more times this year) to combat inflation, plans can often change!

Angela Palacios, CFP®, AIF®, is a partner and Director of Investments at Center for Financial Planning, Inc.® She chairs The Center Investment Committee and pens a quarterly Investment Commentary.

This market commentary is provided for information purposes only and is not a complete description of the securities, markets, or developments referred to in this material. Any opinions are those of the author and not necessarily those of Raymond James. There is no guarantee that these statements, opinions or forecasts provided herein will prove to be correct. Investing involves risk and you may incur a profit or loss regardless of strategy selected. Past performance does not guarantee future results. Diversification and asset allocation do not ensure a profit or protect against a loss.

Inflation Hedges Explored

Nicholas Boguth Contributed by: Nicholas Boguth, CFA®

Print Friendly and PDF

Our Director of Investments, Angela Palacios, recently wrote about the factors influencing current inflation rates. She shared a helpful chart from JPMorgan and summarized, “you may be surprised to see the strong average performance from varying asset classes in this scenario. Inflation that is reasonable and expected can be a very positive scenario for many asset classes.”

As the debate continues over whether or not inflation is “transitory,” some investors are thinking about how to protect their portfolios from rising inflation.

Most bonds, aside from TIPS, are generally expected to perform poorly if inflation rises. This should make sense as the fixed income stream from a bond investment will deteriorate if inflation rises. To protect against inflation, one might conclude that removing bonds from a portfolio makes sense, but not so fast. Bonds are typically in a diversified portfolio to protect from the more common (and devastating) risk – a stock market decline. Be sure to know how your portfolio’s risk exposure would shift before considering a move away from bonds.

Vanguard recently released some research on the topic of inflation hedging and concluded that commodities were the best asset class to protect from unexpected inflation. While commodities are generally accepted to be pretty good inflation hedges, one major risk of owning them has been on display for the past ten years. Their return stream can look significantly different than stocks’. Admittedly, this has been one of the best decades in history for U.S. stocks and one of the worst for commodities. To demonstrate just how “different” the returns can be, if you would’ve held one of the largest commodity ETFs over the past ten years, you would’ve underperformed the U.S. stock market by almost 400%.

Trailing 10-year performance of two ETFs that represent the U.S. stock market and the broad commodities market. SPY (green line) tracks the S&P 500, and DBC (blue line) tracks a basket of 14 commodities. Total return. Source: koyfin.com.

Trailing 10-year performance of two ETFs that represent the U.S. stock market and the broad commodities market. SPY (green line) tracks the S&P 500, and DBC (blue line) tracks a basket of 14 commodities. Total return. Source: koyfin.com.

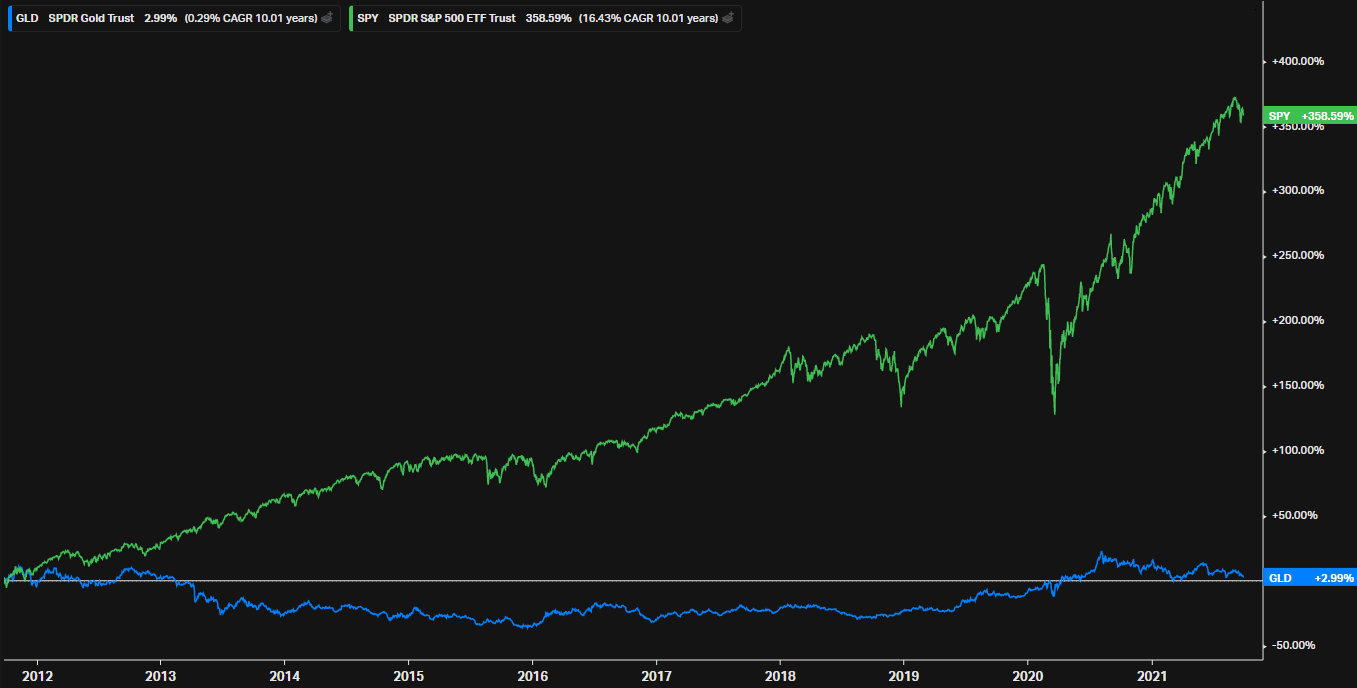
Some portfolio managers like Ray Dalio or First Eagle portfolio managers, Matthew McLennan and Kimball Brooker, have been long time proponents of gold as a hedge against inflation. Gold can be a powerful diversifier in a portfolio, but has also seen sustained periods of underperformance that may make it hard to hold over the long term. Here’s a similar chart of how a popular Gold ETF has performed over the past ten years compared to the red hot S&P 500.

Trailing 10-year performance of two ETFs that represent the U.S. stock market and the price of Gold. SPY (green line) tracks the S&P 500, and GLD (blue line) tracks the gold spot price. Total return. Source: koyfin.com.

Trailing 10-year performance of two ETFs that represent the U.S. stock market and the price of Gold. SPY (green line) tracks the S&P 500, and GLD (blue line) tracks the gold spot price. Total return. Source: koyfin.com.

You may even see articles claiming that bitcoin is the best inflation hedge to add to your portfolio. These opinion pieces make some compelling arguments, but it is important to remember that they are just opinion pieces; emphasis on opinion. We haven’t truly had an inflationary period since bitcoin became popular in the past decade, so there is no way of knowing if its performance has any correlation to U.S. inflation.

Above all else, before jumping to action on your portfolio, remember that inflation is quite hard to forecast. There are an infinite amount of moving parts and multiple ways to measure them. Professional forecasters don’t even agree on what it will look like in the next 12 months, let alone the next ten years or the remainder of your investment time horizon. One of the best ways to hedge against inflation is to talk to your financial advisor and understand how rising inflation might affect your financial plan. That is why we’re here.

Want to know what The Center thinks about inflation? Check out these resources: Inflation and Stock Returns and How Do I Prepare my Portfolio for Inflation.

Nicholas Boguth, CFA® is a Portfolio Administrator at Center for Financial Planning, Inc.® He performs investment research and assists with the management of client portfolios.

Opinions expressed are not necessarily those of Raymond James. The information has been obtained from sources considered to be reliable, but we do not guarantee that the foregoing material is accurate or complete. Past performance is not a guarantee of future results. Investing involves risk and investors may incur a profit or a loss. Treasury Inflation Protection Securities, or TIPS, adjust the invested principal base by the CPI-U at a semiannual rate. Rate of inflation is based on the CPI-U, which has a three-month lag. Bond prices and yields are subject to change based upon market conditions and availability. If bonds are sold prior to maturity, you may receive more or less than your initial investment. There is an inverse relationship between interest rate movements and fixed income prices. Generally, when interest rates rise, fixed income prices fall and when interest rates fall, fixed income prices rise. Investing in commodities is generally considered speculative because of the significant potential for investment loss. Their markets are likely to be volatile and there may be sharp price fluctuations even during periods when prices overall are rising. Gold is subject to the special risks associated with investing in precious metals, including but not limited to: price may be subject to wide fluctuation; the market is relatively limited; the sources are concentrated in countries that have the potential for instability; and the market is unregulated. Bitcoin issuers are not registered with the SEC, and the bitcoin marketplace is currently unregulated. Bitcoin and other cryptocurrencies are a very speculative investment and involves a high degree of risk.

How The Historically High Cost Of Retirement Income Affects Your Financial Plan

Print Friendly and PDF
gfbdfvdf.jpg

Now more than ever, we find ourselves reminiscing. And if you’re like me, it’s usually about the simple things in life that were so easy to take for granted. Like going out to eat with a large group of friends, having a surprise birthday party for a loved one, or attending a sporting event or concert with a packed arena filled with 30,000 fans having a great time. COVID has caused this reminiscing to occur and it has also played a role in reminiscing of a world where investors used to receive a reasonable yield on portfolios for a relatively low level of risk.

Interest rates have been on a steady decline for several decades now, so COVID certainly isn’t the only culprit to blame here. That said, reductions in interest rates by the Federal Reserve when the pandemic occurred in spring 2020, certainly did not help. As an advisor who typically works with clients who are within 5 years of retirement or currently retired, it’s common to hear comments like, “When we’re drawing funds from our accounts, we can just live off of the interest which should be at least 4% - 5%!”. Given historical dividend and bond yield averages and the fact that if we go back to the late 90s, an investor could purchase a 10 year US treasury bond yielding roughly 7% (essentially risk-free being that the debt was backed by the US government), I can absolutely see why those who lived through this time frame and likely saw their parents living off this level of interest would make these sort of comments. The sad reality is this – the good old days of living off portfolio interest and yield are pretty much dead right now (unless of course, you have a very low portfolio withdrawal rate) and it will likely remain this way for an extended period.

One way to look at this is that the average, historical “cost” to generate $1,000 of annual income from a 50% stock, 50% bond balanced portfolio has been approximately $25,000 (translates into an average yield of 4%). Today, an investor utilizing the same balanced portfolio must invest $80,000 to achieve the $1,000 annual income goal. This is a 320% increase in the “cost” of creating portfolio income!  

It’s worth noting that this is not an issue unique to the United States. The rising cost of portfolio income is a global conundrum as many countries are currently navigating negative interest rate environments (ex. Switzerland, Denmark and Japan). Click here to learn more about what this actually means and how negative interest rates affect investors. Below is a chart showing the history of the 10-year US government bond and US large cap equities from 1870 to 2020.

Source: Robert Shiller http://www.econ.yale.edu/~shiller/

Source: Robert Shiller http://www.econ.yale.edu/~shiller/

The chart is a powerful visual and highlights how yields on financial assets have taken a nosedive, especially since the 1980s. The average bond yield over 150 years has been 4.5% and the average dividend yield has been 4.1%. As of December 2020, bond yields were at 0.9% and dividend yields stood at 1.6% - quite the difference from the historical average!

So why this dramatic reduction in yields? It’s a phenomenon likely caused by several factors that we could spend several hours talking about. Some experts suggest that companies have increasingly used stock repurchases to return money to shareholders which coupled with high equity valuations have decreased dividend yields globally. Bond yields have plummeted, in part from a flight to safety following the onset of the pandemic as well as the Federal Reserve’s asset purchasing program and reduction of rates that has been a decade-long trend.

The good news is that a low-interest rate environment has been favorable for stocks as many investors (especially large institutional endowments and hedge funds) are realizing that bonds yields and returns will not satisfy the return requirements for their clients which has led to more capital flowing into the equity markets, therefore, creating a tailwind for equities.

Investors must be cautious when “stretching for yield”, especially retirees in distribution mode. Lower quality, high yield bonds offer the yields they do for a reason – they carry significantly more risk than government and high quality corporate and mortgage-backed bonds. In fact, many “junk bonds” that offer much higher yields, typically have a very similar correlation to stocks which means that these bonds will not offer anywhere near the downside protection that high quality bonds will during bear markets and times of volatility. In 2020, it was not uncommon to see many well-respected high yield bond mutual funds down close to 25% amid the brief bear market we experienced. That said, many of these positions ended the year in positive territory but the ride along the way was a very bumpy one, especially for a bond holding!

The reality is simple – investors who wish to generate historical average yields in their portfolio must take on significantly more risk to do so. It’s also important to note that higher yields do not necessarily translate into higher returns. US large cap value stocks are a perfect example of this. Value stocks, which historically have outperformed growth stocks dating back to the 1920s, have underperformed growth stocks in a meaningful way over the last 5 years. This underperformance is actually part of a longer trend that has extended nearly 20 years. Value companies (think Warren Buffet style of investing) will pay dividends, but if stock price appreciation is muted, the total return for the stock will suffer. Some would argue that the underperformance has been partially caused by investors seeking yield thus causing many dividend-paying value companies to become overbought. In many cases, the risk to reward of “stretching for yield” just isn’t there right now for investors, especially for those in the distribution phase. It simply would not be prudent to meaningfully increase the risk of a client’s allocation for a slight increase in income generated from the portfolio.

As we’ve had to do so much over the past year with COVID, it’s important for investors, especially retirees, to shift their expectations and mindset when it comes to portfolio income. Viewing one’s principal as untouchable and believing yield and income will be sufficient in most cases to support spending in retirement is a mistake, in my opinion. Maximizing total return (price appreciation and income) with an appropriate level of risk will be even more critical in our new normal of low rates that, unfortunately, has no sign of leaving anytime soon.

Nick Defenthaler, CFP®, RICP®, is a Partner and CERTIFIED FINANCIAL PLANNER™ professional at Center for Financial Planning, Inc.® Nick specializes in tax-efficient retirement income and distribution planning for clients and serves as a trusted source for local and national media publications, including WXYZ, PBS, CNBC, MSN Money, Financial Planning Magazine and OnWallStreet.com.


Views expressed are not necessarily those of Raymond James and are subject to change without notice. Information provided is general in nature, and is not a complete statement of all information necessary for making an investment decision, and is not a recommendation or a solicitation to buy or sell any security. There is an inverse relationship between interest rate movements and bond prices. Generally, when interest rates rise, bond prices fall and when interest rates fall, bond prices generally rise. Past performance is not indicative of future results. There is no assurance these trends will continue or that forecasts mentioned will occur. Investing always involves risk and you may incur a profit or loss. No investment strategy can guarantee success.

Should Some Of Your Money Be In Bonds?

The Center's Director of Investments Angela Palacios, CFP®, AIF® explains 3 reasons why you should own bonds.
Print Friendly and PDF

Through thoughtful financial planning, The Center wants to make sure that you achieve your goals regardless of what markets are doing for short periods of time.  We are often asked why we would want to own bonds in a portfolio (especially now with interest rates at all-time lows!). While equity markets generally provide positive returns, there are still periods when they do not.

By their nature, stocks are better than bonds at providing investment returns as there is more risk involved in investing.  There is no promise to repay your principal or interest along the way.  However, while stocks might be better at providing total returns, bonds can provide returns more consistently because of these “promises”.  If we were only focused on investment return, our portfolio would reflect 100% stocks. However, for most investors it still makes sense to continue holding bonds…here are a few reasons why!

Reason #1: To support a withdrawal strategy

One of the worst-case scenarios could have been retiring right before the Great Recession (late 2007).  What if you had retired right before this scenario and needed to withdraw money from your portfolio even as markets corrected?  Owning bonds during times of stress means there is a bucket within your portfolio that you can live on – perhaps for extended periods of time if needed – without having to touch stock positions that are down (they can even provide funds to deploy into equities opportunistically or through routine rebalancing).  Using bonds as your source of income during this time (both the interest and selling bond positions) allows the equity positions a chance to rebound (which usually happens as we have experienced in the past). 

Reason #2: Less Downside Capture

If you capture less of the downside it usually won’t take you nearly as long to get back to your “break-even” or back to where your portfolio value started before equity markets correct.  The below chart does a great job of showing how this looked after the Great Recession.  It shows the dark blue line [a portfolio mix of 60% stock(S&P 500) and 40% bonds (Barclays US aggregate bond index)] recovered nearly a year and a half earlier than a portfolio holding just stock.

JP Morgan Guide to the Markets

JP Morgan Guide to the Markets

Reason #3: Better Investor Behavior

Never underestimate the shock of opening a statement and seeing a swift downturn in your nest egg!  An allocation to bonds can potentially really assist your portfolio in this aspect as shown by the chart above.  If you look at the February ’09 point on the chart and cover up everything to the right of that, ask yourself “Is the “green line” experience something you could shrug off and continue holding or even invest more at this point?”.  Now it is clear that you should have held on to your stock positions but in those moments back in 2009, we didn’t have the benefit of “hindsight” to lean on.

Current Events: What Do Bonds Have Going For Them Now?

JP Morgan Guide to the Markets

JP Morgan Guide to the Markets

All that being said, bonds are in a unique position right now (although similar to where we stood 5 years ago before rates started to rise).  So what do bonds have going for them other than just how they behave as part of your overall return experience?  There are a few tailwinds out there for bonds.  For U.S.-based bonds, while interest rates are low in the U.S., they are still better than other countries with the exception of emerging markets and below investment grade issues.  This steadily attracts buyers of our debt supporting prices even at these low-interest rates.

Another point is that we are still in the midst of a pandemic, there could continue to be unanticipated economic impacts that affect markets unexpectedly.  The economy is pretty vulnerable right now and when we are vulnerable an unexpected shock (black swan event) could have a larger than expected impact on markets if it were to occur.  Remember these are events no one could see coming (like the pandemic itself!).  Right now it is a far easier decision to sell stock positions and rebalance into bonds while calmer markets are prevailing than in the midst of a downturn.  These markets are pricing everything to perfection, rates staying low, Federal reserve continuing with their bond-buying strategies, vaccine dosages being deployed without a hiccup, no more widespread shutdowns, another government stimulus package, etc.  Things don’t always go to plan so adding to bonds helps to insulate you against events that are out of our control.

Another caveat to this is the lower interest rates are, the fewer bonds tend to correlate with stocks.  Meaning when rates are lower the assistance they provide during equity market downturns should be improved.

The chart below provides the historical basis for this view. It shows for each month since 1926 the stock-bond correlation over the subsequent 120 months (orange line). The chart also plots for each month where the 10-year Treasury yield stood (blue line). Notice that the two data series tend to rise and fall in unison, with higher Treasury yields associated with higher stock-bond correlations over the subsequent decade.  It also shows that while the 10-year treasury rate stays below 4% their performance remains uncorrelated or negatively correlated which is exactly what we are hoping for in the event of equity market volatility.

Center for Financial Planning, Inc. Retirement Planning

What If The Markets’ Worst Fears Are Realized And Rates Increase Causing Bonds To Lose Value?

A bad year of performance for bonds is far different than for equities.  This decade has had some tough years for bond positions.  The Bloomberg Barclays US Aggregate bond index has experienced a negative performance calendar year in 2013 (-1.98%) and two years where returns were essentially flat (2015 up .48% and 2018 up .1%).  While it is hard to predict the path of interest rates over the coming year diversification within your bond portfolio will be important.  For example, shortening the duration of the bond portion of your portfolio may help alleviate some of the risks of interest rates rising (remember when interest rates rise bond prices tend to fall).

I hope this helps your understanding as to why we are interested in still owning bonds as a portion of your investment portfolio!  Please don’t hesitate to reach out with any questions you may have!

Angela Palacios, CFP®, AIF® is a Partner and Director of Investments at Center for Financial Planning, Inc.® She chairs The Center Investment Committee and pens a quarterly Investment Commentary.


This material is being provided for information purposes only. Past performance doesn't guarantee future results. Investing involves risk regardless of the strategy selected, including diversification and asset allocation. The Bloomberg Barclays US Aggregate Bond Index is a broad-based flagship benchmark that measures the investment grade, US dollar-denominated, fixed-rate taxable bond market. The S&P 500 is an unmanaged index of 500 widely held stocks that's generally considered representative of the U.S. stock market. You cannot invest directly in any index. Bond prices and yields are subject to change based upon market conditions and availability. If bonds are sold prior to maturity, you may receive more or less than your initial investment. There is an inverse relationship between interest rate movements and fixed income prices. Generally, when interest rates rise, fixed income prices fall and when interest rates fall, fixed income prices rise.

2 Easy Ways To Determine If Your 401k Is Too Aggressive

Matt Trujillo Contributed by: Matt Trujillo, CFP®

Print Friendly and PDF
Center for Financial Planning, Inc. Retirement Planning

For the investor who’s unsure of how their retirement plan works…here are two easy ways to measure how aggressive or conservative your 401k is.

1. Determine your stock-to-bond ratio.

Most custodians offer a pie chart with this information. Login to your 401k account to view the percentage of your money that is invested in stocks and how much is in bonds. In general, it’s aggressive to invest 70% or more in stocks. Once you know your level of risk you should understand if you can handle the ups and downs of that risk emotionally, and also how much risk your long-term planning calls for. 

2. Check your balance at the end of each month.

For example, if an investor’s account jumped from $100K to $110K (10% growth in a month) then they probably have invested most of their money in stocks. This will feel great when things are going up, but that investor needs to be prepared to see some significant paper losses when we experience a downturn like what we just saw in March and April.

So, how can an investor strike a good balance? And when should an allocation change from aggressive to conservative?

As you get closer to taking distributions, it’s reasonable to scale back your stock exposure and move money into safe havens like highly rated corporate bonds and treasury bonds. I say “taking distributions” instead of “retirement” because your plan should be based on when distributions begin. Retirement is a type of distribution event, but not necessarily the only one.

However, if a client has most of their income needs satisfied from other sources and has the emotional appetite to handle the swings, I can see them continuing a more aggressive allocation even in retirement (70% or more in stocks). However, if a client is relying heavily on their portfolio then generally a more conservative allocation is recommended (50% or less in stocks).

Matthew Trujillo, CFP®, is a CERTIFIED FINANCIAL PLANNER™ professional at Center for Financial Planning, Inc.® A frequent blog contributor on topics related to financial planning and investment, he has more than a decade of industry experience.


401(k) plans are long-term retirement savings vehicles. Investing involves risk and you may incur a profit or loss regardless of strategy selected, including diversification and asset allocation. Every investor's situation is unique and you should consider your investment goals, risk tolerance and time horizon before making any investment. Prior to making an investment decision, please consult with your financial advisor about your individual situation.

The Single Most Important Investing Decision

Nicholas Boguth Contributed by: Nicholas Boguth

Most Important Investing Decision Center for Financial Planning, Inc.®

Unsurprisingly, I think investing is fun. This is one of the reasons I’ve chosen a career in investment management. With that being said, my career is only 6 years in. Is it possible that I only think investing is fun because the stock market has hit a new all‐time high every single year of my career? Do stocks ever fall? Why even own bonds that pay 2% coupons?

With the decade being over, and the S&P 500 rising almost 190% over the prior ten years, it seems like a good time to remind ourselves of a few key investing principles.

  • Stocks are risky. Their prices can fall.

  • Bonds are boring, but they have potential to help preserve your portfolio.

  • Asset allocation is the single most important investing decision you will make.

Asset allocation in its simplest form is the ratio of stocks to bonds in your portfolio. More stocks in your portfolio means more risk. More bonds in your portfolio means more potential to balance out the risk of stocks. As financial planners, one of the first decisions we’ll help you make is the decision of what asset allocation is most likely going to lead to your financial success.

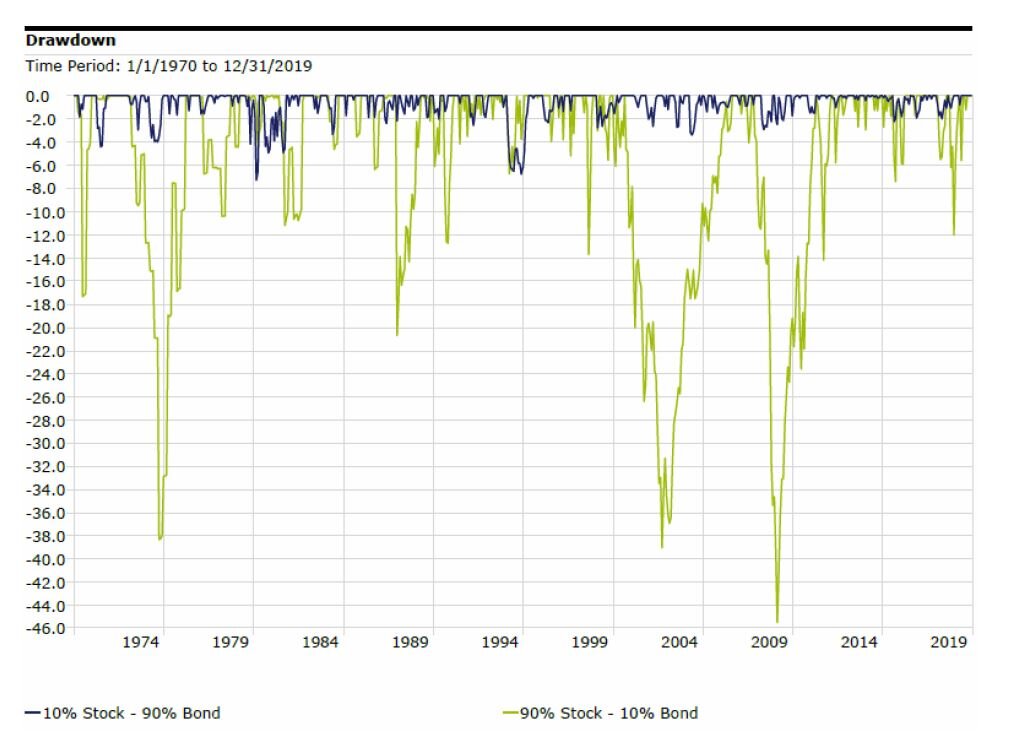
Take a look at the drawdowns of a portfolio of mostly stocks (green line) compared to a portfolio of mostly bonds (blue line). Stocks may have roared through the 2010’s, but no one has a crystal ball to tell us what they will do in the 2020’s. This chart is a good reminder of what stocks CAN do. Be sure that your portfolio is set up to maximize your chance of success no matter what stocks do. If you are unsure about your current portfolio, we’re here to help.

Source: Morningstar Direct. Stock index: S&P 500 TR (monthly). Bond Index: IA SBBI US IT Govt Bond TR (monthly).

Source: Morningstar Direct. Stock index: S&P 500 TR (monthly). Bond Index: IA SBBI US IT Govt Bond TR (monthly).

Nicholas Boguth is a Portfolio Administrator at Center for Financial Planning, Inc.® He performs investment research and assists with the management of client portfolios.


Investing involves risk and you may incur a profit or loss regardless of strategy selected, including diversification and asset allocation.

The information has been obtained from sources considered to be reliable, but we do not guarantee that the foregoing material is accurate or complete. The IA SBBI US IT Government Bond Index is an index created by Ibbotson Associates designed to track the total return of intermediate maturity US Treasury debt securities. One cannot invest directly in an index. Past Performance does not guarantee future results.

Bond woes: “Why do we own bonds if we think they aren’t going to do well in a rising rate environment?”

The Center Contributed by: Center Investment Department

Hoping for capital gains is not a good reason why you should own bonds. Actually, owning or  buying bonds in this low and rising interest rate environment with the hope that you'll be able to sell them later at a higher price may not work out. BUT…just because you can’t sell this investment at a profit later does not make the investment a bad idea.

20181113.jpg

A great real life comparison is a car. We own a car to get our family and us from one place to another, hopefully safely. Many components go into the makeup of a safe driving automobile. The engine is key in making the car go. Stocks act much like the engine of a car.  They make our portfolios go/grow. But, would you ever drive a car that wasn’t equipped with brakes or an airbag? Brakes and airbags are similar to the bonds in our portfolio. Bonds help you control some of the risk of owning stock. For most people, the reason to own bonds is to slow down our bottom-line losses experienced in our portfolio during major market declines. Without this moderation (and sometimes even with it), investors tend to panic when stock prices fall.

So in a nutshell, “Why own bonds?”

They make the scary times less so. When the stock market experiences an extended decline, investors look around for where to turn. Cash and Bonds are usually the place they turn to.A volatile stock market can happen suddenly and unexpectedly. Waiting to add bonds until something happens means you are going to suffer much of the downside before you actually add them to the portfolio. You have to have already had them in the portfolio for them to help. Talk with your financial planner to make sure you have the proper amount of your portfolio invested in bonds so you can hang on to your investments through those difficult times. A portfolio makeup that allows you to stay the course over the long term is much more likely to get you to your destination!


https://www.marketwatch.com/story/why-bonds-are-the-most-important-asset-class-2015-06-10 Links are being provided for information purposes only. Raymond James is not affiliated with and does not endorse, authorize or sponsor any of the listed websites or their respective sponsors. Raymond James is not responsible for the content of any website or the collection or use of information regarding any website's users and/or members.

Investor Ph.D.: Paying a Premium

Co-Contributed by: Angela Palacios, CFP®Angela Palacios and DewRina Lee DewRina Lee

We aren’t talking Healthcare or Prada even, though you pay premiums for both. Rather, we are discussing why investors may pay a premium for bonds. Bonds are frequently purchased at prices below or above par; that is, at a discount or a premium. Bonds trade at a discount when the coupon rate is lower than the market interest rate, and they trade at a premium when its coupon rate is higher than the market interest rate.

For the purpose of this blog, we will be focusing mainly on the reasons behind why someone may choose a premium bond.

Take the following scenario:

Intuition seems to indicate that when deciding between a discount bond at a price of $970 and a premium bond at a price of $1,030, an investor should take the discount option. It’s always more fun to buy that Prada purse when it’s on sale right? But, there are times when you may want to pay the higher price, for example, if you want the latest season’s purse rather than last seasons.

But enough about my purse addiction, let’s get back to bonds. If the bond matures at $1,000, a discount bond holder who bought at $970 will be pocketing $30 while a premium bondholder who paid $1,030 will be losing $30, right? Not exactly. The higher price a premium bondholder has paid is made up for by the higher interest payments they will earn along the way. In many cases, the additional cash flow more than pays for the cost of the premium price paid up-front. Take a look at the following example:

Additionally, due to its larger cash flows, the time it takes to repay the initial investment is shortened. With all else equal, the higher the coupon rate, the shorter the duration. As such, premium bonds can be more defensive in a rising interest rate environment and potentially less volatile. Also, this larger cash flow allows investors to reinvest more in new bonds to capture potential rate increase. By no means does this mean that premium bonds are immune to rising rates; however, they may offer a way to capture the higher yields with some degree of downside protection in a declining market.

So why pay a premium? In essence, there are a few advantages of buying premium bonds:

  • Higher coupon rate

  • Shorter duration to pay off your initial investment

  • Less sensitivity to fluctuations in interest rates

  • Opportunity to reinvest at a potentially higher rate.

Of course, there are additional risks and financial objectives that are personalized to each individual. Contact your financial planner to figure out how bonds may fit into your personalized financial plan!

Angela Palacios, CFP® is the Director of Investments at Center for Financial Planning, Inc.® Angela specializes in Investment and Macro economic research. She is a frequent contributor The Center blog.

DewRina Lee is an intern at Center for Financial Planning, Inc.®


This information has been obtained from sources considered to be reliable, but we do not guarantee that it is accurate or complete; it is not a complete summary or statement of all available data necessary for making an investment decision and does not constitute a recommendation. Investments mentioned may not be suitable for all investors. Opinions expressed are those of Angela Palacios and DewRina Lee and are not necessarily those of Raymond James. There is an inverse relationship between interest rate movements and bond prices. Generally, when interest rates rise, bond prices fall and when interest rates fall, bond prices generally rise. There are special risks associated with investing with bonds such as interest rate risk, market risk, call risk, prepayment risk, credit risk, reinvestment risk, and unique tax consequences. The example provided is hypothetical and has been included for illustrative purposes only, it does not represent an actual investment.

Investor Basics: Embedded Bond Features

Contributed by: Nicholas Boguth Nicholas Boguth

This time around in our “Investor Basics” series, we’re going to take a look at the most common bond features. For a dive into a more complex bond pricing topic, check out our Director of Investment’s Investor Ph. D blog on why buying premium bonds can make sense.

First off, what is an embedded bond feature?

An embedded bond feature is a provision attached to a bond that changes its maturity, risk, or liquidity. A bond issuer may release a bond with an embedded feature in order to make it more attractive to a bond buyer, or to give itself a more favorable debt structure. The most common types of embedded features that you may have seen in the market, and that I will briefly go over in this blog, are call, put, and conversions.

Call features give the issuer of the bond the right to “call” the bond back from the bondholder at a specific date. This provision benefits the issuer because they are able to buy back debt, and then issue new debt at a lower interest rate. A company will typically issue a callable bond when they believe that interest rates will decrease in the future. Since this feature benefits the issuer, the company will have to make the yield or maturity more attractive to entice a buyer.

Put features give the bondholder the right to “put” the bond back to the issuer at a specific date before it matures. This provision benefits the bondholder because it allows him or her to put the bond back to the issuer (maybe interest rates have risen or the company’s credit is deteriorating). Since this option benefits the bondholder, he or she may have to accept a lower yield or longer maturity on the bond.

Another common embedded bond feature is the conversion option. This actually lets the bondholder convert the bond into shares of the company’s stock at a predetermined price and date. A company may issue convertible bonds as a way to issue cheap debt (they may not have to pay as large of a coupon because they are giving the bondholder the option to convert their bond to stock).

Each of these bond features may have a place in an investor’s portfolio, but knowing when and how to include them can be complex and differs from investor to investor. If you have any questions on these bond topics or any others, feel free to reach out to us at any time!

Nicholas Boguth is an Investment Research Associate at Center for Financial Planning, Inc.® and an Investment Representative with Raymond James Financial Services.


The information contained in this report does not purport to be a complete description of the securities, markets, or developments referred to in this material. Any information is not a complete summary or statement of all available data necessary for making an investment decision and does not constitute a recommendation. Every investor’s situation is unique and you should consider your investment goals, risk tolerance and time horizon before making any investment. Investing involves risk and you may incur a profit or loss regardless of strategy selected. Investments mentioned may not be suitable for all investors. There is an inverse relationship between interest rate movements and fixed income prices. Generally, when interest rates rise, fixed income prices fall and when interest rates fall, fixed income prices generally rise.

Asset Flow Watch 2Q 2017

Contributed by: Jaclyn Jackson Jaclyn Jackson

One of the most common ways to monitor consumer confidence and investor sentiment is to watch fund inflows and outflows. Market analysts use fund flows to measure sentiment within asset classes, sectors, or markets. This information (combined with other economic indicators) help identify trends and determine investment opportunities.

A new trend may be emerging as international fund flows are outpacing US fund flows in the second quarter. The move towards taxable bonds that began in January 2017 continued as investors have handled high U.S. stock valuations gingerly.

Asset Flows: What Investors Did This Quarter

An even distribution of flows went towards taxable bonds and international equities in April. The fear of France’s exit from the European Union dissipated as Emmanuel Macron won the French presidential elections. Accordingly, flows moved into foreign large blend funds. To boot, MSCI Emerging Markets Index returns (13.9%) increased inflows to diversified emerging markets. On the other hand, first quarter GDP growth (0.7%) and political unpredictability sucked life from post-election US equity inflows. 

By May, US equity deceleration evolved into outflows. International equity flows remained strong.  Taxable bond flows continued in spite of raised rates. Republican tax cut plans created municipals bond outflows; likely because investors don’t think federal tax exemptions will be as advantageous as they have been in the past. 

Early quarter trends have continued through June. As of June 21, 2017, US equity outflows were -$1.205 billion, international equity inflows were $1.467 billion, emerging markets inflows were $0.300 billion, and taxable bond inflows were $3.016 billion.

Is the US Equity Run Over?

While the debate about the end of the US equity run ensues among industry professionals, the discussion may be mute among investors. It appears that many investors, figuring the US recovery is further along than the rest of the world, have opted to either “play it conservative” with bonds or invest internationally where there is seemly more opportunity for equity values to grow.

Jaclyn Jackson is a Portfolio Administrator and Financial Associate at Center for Financial Planning, Inc.®


This information does not purport to be a complete description of the securities, markets, or developments referred to in this material; it has been obtained from sources considered to be reliable, but we do not guarantee that it is accurate or complete. Any opinions are those of Jaclyn Jackson and are not necessarily those of Raymond James. This information is not a complete summary or statement of all available data necessary for making and investment decision and does not constitute a recommendation. Investing involves risk, investors may incur a profit or loss regardless of the strategy or strategies employed. International investing involves special risks, including currency fluctuations, differing financial accounting standards, and possible political and economic volatility. Investing in emerging markets can be riskier than investing in well-established foreign markets. Asset allocation does not ensure a profit or guarantee against loss. Past performance is not a guarantee of future results. The MSCI Emerging Markets is designed to measure equity market performance in 25 emerging market indices. The index's three largest industries are materials, energy, and banks. Please note direct investment in any index is not possible.