Investment Perspectives

Second Quarter Investment Commentary 2020

Second Quarter Investment Commentary 2020

As the economy slowly opened and our grocery store shelves were restocked, the second quarter became one of the best in decades.  Tailwinds such as government stimulus, positive trends in “flatting the curve”, economic reopening, good news on virus treatment, and hope of a vaccine gave investors the confidence they needed to flock back into stocks.  This comes in stark contrast to the first quarter with a dizzying correction for the S&P 500 down 34% in about one month.

Second Quarter Investment Commentary 2020

Many are left wondering if this is too good to be true and there are several different and all very valid view points on this matter. 

How can equities be back to near-peak levels when we are still in a pandemic?

As indexes recovered much of what they lost in the first quarter, some investors are left scratching their heads wondering how this could be when businesses lost out on so much during the shutdown of the economy.  At first glance, this does seem to be strange.  There are several possible reasons this has occurred.

1. The hardest hit companies were small businesses not reflected in large indexes like the S&P 500.  When people couldn’t frequent their local small businesses for the goods they needed during the shutdown they turned to online shopping from big box places in droves.  So, what small businesses have lost, large businesses have gained (at least in the short term).

2. Government provided assistance in the form of forgivable debt to small businesses and issuing checks directly to individuals.  So, not only, were people stuck at home with nowhere to spend their income (other than fixed bills), but they were also given stimulus checks.  For many, this provided a much needed back stop to pay important bills like a mortgage or car payment.  However, the data also shows that much of this has been put away for a rainy day.  Check out the historical chart below of the M1 Money Stock (the amount of money held by individuals that is ready to spend. ie. currency and checking account deposits in the US).  We have never seen a spike of this magnitude.

Second Quarter Investment Commentary 2020

As businesses have reopened, many goods and services are in high demand like automobiles and home improvement.  People are now spending the money they couldn’t spend while stuck at home and the market is pricing this into results that should be reflected in the next quarter’s earnings reports.

3. Lower interest rates mean home owners can refinance debt at lower interest rates, putting more money in their pockets and less in the bank’s pockets.  People can also buy new cars with 0% financing.  Lower interest rates also leave those seeking income on investments with very few places to turn other than equities to replace the loss in income.

What could cause the markets to head right back down?

I have this feeling that the economy is balancing on the edge of a knife right now.  The momentum is forward toward recovery but several risks could slow or undermine that momentum:

  • A resurgence of the virus – COVID-19 alone isn’t the cause of a potential market pull back, but this does increase the probabilities of parts of the economy having to close for periods.  A good case in point is the recent closure of indoor bar service in parts of Michigan after several bar gatherings have been identified as sources of local spikes in cases.  I don’t think we will see widespread shut down of economies again but there will be pockets of this occurring.

  • Expiration of supplemental unemployment benefits – If people are unable to go back to their jobs, or find new ones, the loss of the extra unemployment income at the end of July could be a significant hit to consumer confidence.  This means that the e-spending habits that are currently boosting the economy, could go away very quickly.  I view this as the largest risk to the recovery right now because unemployment is at 11.1% nationally with Michigan being one of the hardest-hit states for job loss.  As shown by the chart below, we have not experienced such widespread job loss in a recession in recent history.  The jobs data from the Bureau of Labor Statistics for June shows that we are adding a large number of jobs back so, for right now, we appear to be improving on this front.

Second Quarter Investment Commentary 2020
  • Governments failing to provide more stimulus if needed – How politics play out is always an unknown that cannot be predicted but if shutdowns become more widespread again, people will look to the government for more assistance.  If this isn’t provided we could see a swift correction.  I believe, if needed, we will see more stimulus in the future as the government has proven with it’s actions that it does stand ready to support the economy.

  • How many small business will survive?  This is a question that only time will tell but the risk is high that many will not.  They represent a large employer in the economy so major closures will have a highly negative impact on employment numbers.

What are we doing in response?

The Investment Committee is discussing topics like “How to invest through periods of low to negative interest rates?” and “How do we best help clients achieve their financial goals when deficits and current valuations could be a long term anchor to portfolio returns?”  Our Jaclyn Jackson, CAP® recently wrote the blog How To Invest In Turbulent Markets where she articulates what we can control, representing a great summary of what we do behind the scenes for our clients. 

Not long ago the markets and the economy seemed to be in freefall, but we just had one of the best quarters ever for market returns.  It is important to remember that investors look at whether things are getting better or worse; this is a large driver of markets.  At the end of the first quarter, things were getting worse and investors had no idea where a bottom could be or how long we would be shut down.  Since then, much has improved, we have more knowledge on this virus and the economy continues to improve which explains why the markets are up (even though the magnitude may not make intuitive sense).  These vast swings in sentiment have created many opportunities for changes in portfolios.  If you ever have questions regarding the addressed topics and how it relates to your portfolio, please don’t hesitate to reach out to discuss.  We are here for you and thank you for your continued trust.

Angela Palacios, CFP®, AIF®

Partner & Director of Investments

Angela Palacios, CFP®, AIF®, is a partner and Director of Investments at Center for Financial Planning, Inc.® She chairs The Center Investment Committee and pens a quarterly Investment Commentary.


Opinions are those of the author and not necessarily those of Raymond James. There is no guarantee that these statements, opinions or forecasts provided herein will prove to be correct. Past performance doesn't guarantee future results. Investing involves risk regardless of the strategy selected The S&P 500 is an unmanaged index of 500 widely held stocks that's generally considered representative of the U.S. stock market. You cannot invest directly in any index.

Print Friendly and PDF

How To Invest Your Money In Turbulent Markets

Jaclyn Jackson Contributed by: Jaclyn Jackson, CAP®

Print Friendly and PDF
Center for Financial Planning, Inc. Retirement Planning

Navigating daily market fluctuations through COVID-19 has been challenging. With every newsfeed from Washington or new economic data numbers, markets react. So what do we make of this as investors? Well, it truly depends on your circumstance. For individuals who have a long investment horizon and stable finances, there may be an opportunity to take advantage of market inefficiencies.

For individuals who have experienced (or anticipate) financial changes, it may be time to reevaluate your investment approach. Here are a few ideas to discuss with your advisor when considering investment strategies during the coronavirus pandemic.

Strategies for Long-Term Investors

For long-term investors, volatile markets should not discourage commitment to your investment plan. Staying invested, reestablishing your asset allocation, gradually investing, and generating tax opportunities are still valuable to progressing your investment aims. Think about the following strategies:

  1. Rebalance - Rebalancing is a systematic way of adapting the commonly suggested investment advice, “buy low and sell high”. It disciplines investors to trim well-performing investments and buy investments that have the potential to gain profits. In our current environment, that looks like trimming from bond positions and investing in equities for many people. Importantly, rebalancing helps investors maintain their established asset allocation; someone’s predetermined investment allocation suited to meet their investment objectives. In other words, rebalancing helps investors maintain the risk/return profile meant to enhance their probability of meeting long-term goals.

  2. Dollar-Cost Average - A gingerly alternative to rebalancing is dollar-cost averaging. Investors who use this strategy identify underexposed asset classes and invest a set amount of money into those assets at a set time (i.e. monthly) over a set period (i.e. 1 year). This method helps investors buy more shares of something when it is inexpensive and fewer shares of something when it is expensive. Buying at a premium when the market is up is stabilized by taking advantage of prices when the market is down. Therefore, the average cost paid per share of your investment is cheaper than just paying the premium prices. Having a dollar-cost averaging strategy in place now, while markets have dipped, helps you buy more shares of investments while they cost less.

  3. Tax Loss Harvest - Selling all or part of a position in your taxable account when it is worth less than what you initially paid for it creates a realized capital loss. Losses can offset capital gains and other income in the year you realize it. If realized losses exceed realized gains during that year, realized losses can be carried forward (into future years). Harvesting losses could help investors replace legacy positions, diversify away from concentrated positions, or stow away losses for more profitable times.

  4. Do Nothing - The key here is to stay invested. The challenge with fleeing investment markets when they are down is that it is incredibly hard to time reinvesting when they will go back up. Missing upside days may inhibit full recovery of losses. According to research developed by Calamos Investments, missing the 20 best days of the S&P 500 over 20 years (1/1/99 – 12/31/19) reduced investment returns by two-thirds. Time, not market timing, supports you in meeting your investment goals.

Strategies Amid Financial Hardships

Many people’s employment and financial situations have changed. Understandably, some have to review their ability to invest. If you are concerned about losing your job or potential health issues, it is time to revisit your savings. Could your rainy day resources cover 6-8 months of financial needs? If not, you will likely need to build up savings. For those who are experiencing financial challenges, consider the following strategies:

  1. Add to emergency funds by lowering or pausing retirement account contributions. Luckily, you do not have to liquidate part of your retirement account with this strategy. Staying invested gives your portfolio a chance to benefit from long-term performance. If your employer matches retirement account contributions, continue to invest up to that amount, then add to savings with the balance of your normal participation amount. Once savings needs are met, resume full investment participation.

  2. Rebalance your portfolio to provide liquidity. As noted above, rebalancing takes earnings off the table from investments that have performed well. However, instead of reallocating to other investments, use proceeds to increase your rainy day savings. This method prevents you from selling off positions that are at a loss.

Jaclyn Jackson, CAP® is a Portfolio Administrator at Center for Financial Planning, Inc.® She manages client portfolios and performs investment research.


Please note, the options noted above are not for everyone. Consult your advisor to determine which options are appropriate for you. Investing involves risk and you may incur a profit or loss regardless of strategy selected. The S&P 500 is an unmanaged index of 500 widely held stocks that is generally considered representative of the U.S. stock market. Keep in mind that individuals cannot invest directly in any index, and index performance does not include transaction costs or other fees, which will affect actual investment performance. Individual investor's results will vary. Past performance does not guarantee future results. Diversification and asset allocation do not ensure a profit or protect against a loss. Rebalancing a non-retirement account could be a taxable event that may increase your tax liability. Raymond James and its advisors do not offer tax or legal advice. You should discuss any tax or legal matters with the appropriate professional.

When Stock Markets Fall 20%

Nicholas Boguth Contributed by: Nicholas Boguth

Print Friendly and PDF
When Stock Markets Fall 20% Center for Financial Planning, Inc.®

We are supposed to know that stocks are risky, but that doesn’t make holding onto them any easier during turbulent times like these. Hopefully this post provides some optimism for anyone invested in stocks, both domestic and international.  

What happened if you invested $1 in a stock market after it crashed 20% or more?

I took 15 stock indexes representing the largest economies in the world and found the date when they fell 20% from an “all-time high” like the U.S. markets did this past March. I counted 68 of these drawdowns in Morningstar’s database. Below is the performance of $1 over the 10 years following each drawdown.

This is a hypothetical example for illustration purposes only. Investors cannot invest directly in an index.

This is a hypothetical example for illustration purposes only. Investors cannot invest directly in an index.

In this example, blue lines ended positive. Red lines ended negative. $1 invested after a 20% drawdown turned positive 64 out of the 68 times. There were only 4 negative time periods (Hong Kong & Italy in ’73, Brazil & Italy in ’08). In the worst 10 year period, the index was down 28% and ended at $0.72. The best instances returned over 600%, and even all the way up to 1,100%!

The economy is tanking, should I get out of the market?

Every investor has thought about this question at least once, probably multiple times, during his or her lifetime. I’m not going to answer it for you here, because there is no universal answer. Investing is not one-size-fits-all. Time horizon, spending goals, cash flows, risk tolerance, and your entire financial plan will affect the decision. We work with our clients to ensure that they have a plan in place before it is too late. If you are unsure of your plan, or need to create one, feel free to reach out to us by phone, email, or on our social media.   

Source: Morningstar Direct. Indexes and dates shown below. Total return, monthly data.

Source: Morningstar Direct. Indexes and dates shown below. Total return, monthly data.

Keep in mind that individuals cannot invest directly in any index, and index performance does not include transaction costs or other fees, which will affect actual investment performance. Individual investor's results will vary. Past performance doesn't guarantee future results. Investing involves risk regardless of the strategy selected, including diversification and asset allocation. Holding investments for the long term does not insure a profitable outcome.

International investing involves special risks, including currency fluctuations, differing financial accounting standards, and possible political and economic volatility.

Nicholas Boguth is a Portfolio Administrator at Center for Financial Planning, Inc.® He performs investment research and assists with the management of client portfolios.


A free float-adjusted market capitalization weighted index that is designed to measure the equity market performance of developed markets. The MSCI World Index consists of the following 24 developed market country indices: Australia, Austria, Belgium, Canada, Denmark, Finland, France, Germany, Greece, Hong Kong, Ireland, Israel, Italy, Japan, Netherlands, New Zealand, Norway, Portugal, Singapore, Spain, Sweden, Switzerland, the United Kingdom, and the United States. With Net Dividends (Total Return Index): Net total return indices reinvest dividends after the deduction of withholding taxes, using (for international indices) a tax rate applicable to non-resident institutional investors who do not benefit from double taxation treaties. The S&P 500 is an unmanaged index of 500 widely held stocks that is generally considered representative of the U.S. stock free float-adjusted market capitalization index that is designed to measure the equity market performance of developed markets, excluding the United States & Canada. As of June 2007 the MSCI EAFE Index consisted of the following 21 developed market countries: Australia, Austria, Belgium, Denmark, Finland, France, Germany, Greece, Hong Kong, Ireland, Italy, Japan, Netherlands, New Zealand, Norway, Portugal, Singapore, Spain, Sweden, Switzerland, and the United Kingdom. (Total Return Index) - With Net Dividends: Approximates the minimum possible dividend reinvestment. The dividend is reinvested after deduction of withholding tax, applying the rate to non-resident individuals who do not benefit from double taxation treaties. MSCI Barra uses withholding tax rates applicable to Luxembourg holding companies, as Luxembourg applies the highest rates. The MSCI EAFE Index (Europe, Australasia, Far East) is a free float-adjusted market capitalization index that is designed to measure the equity market performance of developed markets, excluding the US & Canada. The MSCI EAFE Index consists of the following 21 developed market country indexes: Australia, Austria, Belgium, Denmark, Finland, France, Germany, Hong Kong, Ireland, Israel, Italy, Japan, the Netherlands, New Zealand, Norway, Portugal, Singapore, Spain, Sweden, Switzerland, and the United Kingdom. The MSCI Hong Kong Index is designed to measure the performance of the large and mid-cap segments of the Hong Kong market. With 43 constituents, the index covers approximately 85% of the free float-adjusted market capitalization of the Hong Kong equity universe. The MSCI Japan Index is designed to measure the performance of the large and mid-cap segments of the Japanese market. With 323 constituents, the index covers approximately 85% of the free float-adjusted market capitalization in Japan. The MSCI Germany Index is designed to measure the performance of the large and mid-cap segments of the German market. With 59 constituents, the index covers about 85% of the equity universe in Germany. The MSCI United Kingdom Index is designed to measure the performance of the large and mid-cap segments of the UK market. With 96 constituents, the index covers approximately 85% of the free float-adjusted market capitalization in the UK. The MSCI France Index is designed to measure the performance of the large and mid-cap segments of the French market. With 77 constituents, the index covers about 85% of the equity universe in France. The MSCI Italy Index is designed to measure the performance of the large and mid-cap segments of the Italian market. With 24 constituents, the index covers about 85% of the equity universe in Italy. The MSCI Canada Index is designed to measure the performance of the large and mid-cap segments of the Canada market. With 89 constituents, the index covers approximately 85% of the free float-adjusted market capitalization in Canada. The Russell 2000 Index measures the performance of the 2,000 smallest companies in the Russell 3000 Index, which represent approximately 8% of the total market capitalization of the Russell 3000 Index.

How To Invest In A Bear Market

The Center Contributed by: Center Investment Department

How to invest in a bear market? Center for Financial Planning, Inc.®
Print Friendly and PDF

In a Q+A, our Director of Investments Angela Palacios, CFP®, AIF® provides valuable advice on the dos and don’ts of investing in a bear market. A “bear market” is when assets fall at least 20% or more from their high. We are currently facing a bear market.

What is a bear market and what triggers them? 

A variety of situations can cause a bear market. They can be event-driven, which explains the current bear market. A black swan event like COVID-19 or a shock in commodity prices like the price war on oil can cause bear markets that lead to recessions. In the case of late 2018, that brief bear market was driven by the trade-war escalation. This example did not lead to a recession. Financial imbalances like high inflation, increasing interest rates from the Federal Reserve, or banks being too leveraged (like in 2008) are all issues that can trigger a bear market and lead to an eventual recession.   

What's good/bad about investing in a bear market? 

Data from historical bear markets indicate that they are excellent investment opportunities, however, it is the most difficult time to invest. Bear markets allow us to tax-loss harvest to offset future capital gains, ultimately reducing our tax bills. We can rebalance out of positions that may not be our highest conviction investing ideas that we have had to hold on to due to high capital gains embedded in those positions.

What investments are best for a bear market and why?

We believe “Core Fixed Income” is often the best strategy to offset the downside risk from equities. These include positions like U.S. Treasuries and High-Quality Corporate debt. Generally, when equities are going down, investors are buying these types of investments. Cash is also a good insulator during times like this. Even though interest rates are low, there is no substitute for its safety. It is very important to always have your next 6-18 months of cash needs set aside so you don’t have to liquidate during times of market turmoil.

What should a brand new investor know about building a portfolio in a bear market? Is it a good time for newbies to enter the market while prices are down? 

Start building a portfolio regardless of whether we are in a bull market or a bear market. The old saying goes, “Time in the market is more important than timing the market”. Most investors save systematically throughout their lives rather than investing in one lump sum. We save every month through our 401(k) deferrals or every year when we get that bonus from work. Dollars go farther in bear markets because the shares of the mutual fund you are buying are now on sale. Investing is the only time in life when buying something on sale doesn’t feel good, but it should if you have a long time horizon to save.

What advice do you have for managing a portfolio in a bear market and when it begins to turn bullish again? For example, how do you manage risk and asset allocation to stay on target with your goals? 

The investing strategy and financial planning goals should be developed during quieter times. Thinking ahead to how you should react during times like this is crucial because in the moment our emotions are very difficult to overcome. A rebalancing strategy also needs to be developed at the same time you are developing your investment strategy. It is a concept that sounds simple but can be very easy to neglect. When markets are doing great and there is very low volatility (like January of this year), you may be tempted to let your best-performing investments run just a little bit longer before rebalancing…meaning you hold your stock positions rather than rebalancing into bonds. In other years that may have been fine, but this year it was not. So, having thresholds around how much stock and bonds you have in your portfolio can take the guesswork out of when to rebalance. That is extremely important at the depths of a bear market because one of the best ways to help your returns coming out of a bear market is simply to rebalance back to your target allocation of stocks and bonds. When markets are down, this means selling bonds and buying stocks.

We hope you found this informative. If you have additional questions, please contact your advisor!

This material is being provided for information purposes only. Past performance doesn't guarantee future results. Investing involves risk regardless of the strategy selected, including diversification and asset allocation. Rebalancing a non-retirement account could be a taxable event that may increase your tax liability.

First Quarter Investment Commentary 2020

First Quarter Investment Commentary Center for Financial Planning, Inc.®
Print Friendly and PDF

As the first quarter of 2020 comes to an end, COVID‐19 has brought the world together in an unusual way. We are now using strange new language like “social distancing” and “shelter in place”. Many of us are now meeting via Zoom (daily users of the videoconferencing platform skyrocketed from 10 million to 200 million). On the lighter side, #QuarantineMadeMeDoIt is trending on social media and we may be watching TV shows that weren’t worth our time before. Schools have been canceled in some states, forcing families to juggle their careers and childcare. Layoffs are a difficult reality for many at this time (luckily, not any Center employees due to smart planning!). We can only stay positive and hope that the drastic efforts to stop the spread of the coronavirus are effective. There is no doubt that COVID‐19 will make history books and there will be many lessons learned as we digest the far‐reaching consequences of this time.

How Did Markets Perform?

The spread of COVID‐19 began in China late last year and impacted their domestic markets, but not the global markets. As the virus spread globally, markets around the world reacted. With the virus came fear manifesting in many different ways, from hoarding toilet paper to hoarding cash. Investors were selling anything they could with a “sell first, ask questions later” mentality. The stock market saw wild swings that haven’t occurred since the 2008 recession. However, the current swings feel much worse because they happened over less time. The markets were generally either negative or positive in a large way each day with an average daily movement of 5% during March! The circuit breakers were triggered on 3 separate occasions, pausing trading for 15 minutes each time (this occurs when the S&P drops by 7% on any given trading day).

Here’s how various indexes closed the quarter:

Center for Financial Planning Inc

Monetary Stimulus

The Federal Reserve (the Fed) responded first to COVID‐19 aiming to keep financial markets from spiraling out of control. While their actions could not prevent the economic downturn that is already upon us, the Fed could create more accommodative financial conditions that would help cushion the landing of a recession and support the economy’s eventual recovery. In the near term, the Fed’s actions have aimed to support smooth functioning in financial markets and ensure that the problems on Wall Street do not spill onto Main Street. Below is a timeline of their actions to help support the various functions of the financial markets.

Source: Performa, Federal Reserve

Source: Performa, Federal Reserve

Take a look at the last point “What’s Next?” Well, the Magic 8‐Ball was correct. The Fed further expanded facilities to support municipal and high‐quality corporate bonds. They also purchased highly liquid fixed income exchange‐traded funds to further support the bond markets. These actions were straight from the toolkit developed through the financial crisis of 2008‐2009 (except for purchasing the exchange‐traded funds). Back then, it took the Fed nearly a year to deploy these actions. Thankfully, this year it was deployed in a matter of weeks.

Fiscal Stimulus

This accommodative policy from the Fed made it easier for large‐scale fiscal stimulus to be financed by cheap debt. The government responded with the CARES Act, a $2 Trillion stimulus package. It makes history as the largest stimulus package in the U.S. The goal is to inject a large amount of money into the economy to carry businesses and individuals through this hopefully short, but very challenging time. Learn more about the CARES Act here.

The rising national debt levels in the U.S. are a concern, however, there may be a reason to go into more debt. “If ever there is a time for the government to add to our debt, it is now,” says Kenneth Rogoff, a Harvard economist who often speaks on the risks of the spiraling national debt. He says, “We are in a war, the whole point of not relying on debt excessively in normal times is precisely to be able to use debt massively and without hesitation in situations like this”.

There is a risk of the national debt growing and burdening society in the years to come. This will be on our minds in the coming years. However, it is good to remember that our country’s debt burden, or interest, is a far smaller percentage of GDP than back in 1999. There are two reasons for this. Our GDP has grown since 1999 and interest rates the government pays on the debt are far lower. Think of how much more home you can afford when your mortgage interest rate is 2.7% instead of 6%.

Below is an excellent graphic displaying tools that have been used and what options remain.

Center for Financial Planning Inc

An Oil War

Our eyes aren’t only on the coronavirus pandemic. An oil war was brewing between Russia and Saudi Arabia. We are in the midst of a price war because both countries did not agree on a response to a falling demand. They decided, instead, to flood the world with an abundance of cheap oil. This pushed oil prices to their lowest levels in 18 years (of course when gas is cheap, we can’t go anywhere!). More seriously though, couple this with people consuming less oil because of the pandemic keeping us home and this has spelled disaster for energy company stock prices. As I write this, the price war appears to be de‐escalating and there are talks of cutting production to support oil prices.

The Economic Fallout

Despite the unprecedented response from both the U.S. government and the Fed, the pandemic will surely leave its mark on the economy. Early data is being released and it is ugly. Manufacturing/service activity has drastically slowed and unemployment is on the rise.

However, ugly was expected by markets and much of the ugliness has been potentially priced in. We may see the equity market lows retested (or even go a bit lower) in the coming weeks before everyone gets back to work and the economy restarts. This will be highly dependent on flattening the coronavirus curve. If we see positive results from the stay‐at‐home orders and the virus infection rates slow, the markets could recover in the coming weeks and months even as the economy falls into a recession.

What Is The Center Doing In The Meantime?

Accounts have had higher than normal activity this year due to the volatile markets. After a strong 2019, our process called for rebalancing from stock to bonds to keep recommended asset allocations on target. We monitor to make sure any upcoming cash needs are set aside ahead of time. After the sharp drawdown in markets, for many, we have needed to rebalance from bonds back into stocks. We have been able to proactively tax-loss harvest for those who needed it and identify investment opportunities to take advantage of.  For example, the Investment Committee is keeping an eye on U.S. Equities after reviewing the policy responses available to be deployed around the world. We feel the U.S. should be better positioned for recovery after the effects of the pandemic start to wear off.

In the Center’s 35 year history we have been through bear markets and surely will again after this. Bull markets follow bear markets and much of the recovery usually comes in the front end of the bull market and often well before the economy starts to recover. While we can’t predict when the next bull market will begin, your portfolio must be positioned properly for when that happens. It is important to stick to a thoughtful plan that was established during quieter/more rational times. Try to tune out the media and focus on your long‐term goals.

Thank you for the trust you place in us to manage your wealth and to advocate for your financial wellness. There could be no greater responsibility, especially during uncertain times. We strive to stay in touch and hope our communications via email, phone, and Zoom has been helpful. If you have questions or concerns please reach out to your planner! This is why we are here for you!

Angela Palacios, CFP®, AIF®, is a partner and Director of Investments at Center for Financial Planning, Inc.® She chairs The Center Investment Committee and pens a quarterly Investment Commentary.


There is no guarantee that these statements, opinions or forecasts provided herein will prove to be correct. This material is being provided for information purposes only. Past performance doesn't guarantee future results. Investing involves risk regardless of the strategy selected, including diversification and asset allocation. Holding investments for the long term does not insure a profitable outcome. You cannot invest directly in any index. The S&P 500 is an unmanaged index of 500 widely held stocks that are generally considered representative of the U.S. stock market. The Bloomberg Barclays US Aggregate Bond Index is a broad-based flagship benchmark that measures the investment grade, US dollar-denominated, fixed-rate taxable bond market. The Russell 2000 Index measures the performance of the 2,000 smallest companies in the Russell 3000 Index, which represent approximately 8% of the total market capitalization of the Russell 3000 Index. The MSCI EAFE (Europe, Australasia, and Far East) is a free float-adjusted market capitalization index that is designed to measure developed market equity performance, excluding the United States & Canada. The EAFE consists of the country indices of 22 developed nations. The MSCI Emerging Markets is designed to measure equity market performance in 25 emerging market indices. The index's three largest industries are materials, energy, and banks.

Think Portfolio Diversification is Overrated – Read This

Jaclyn Jackson Contributed by: Jaclyn Jackson

Print Friendly and PDF
Think Portfolio Diversification is Overrated - Read This

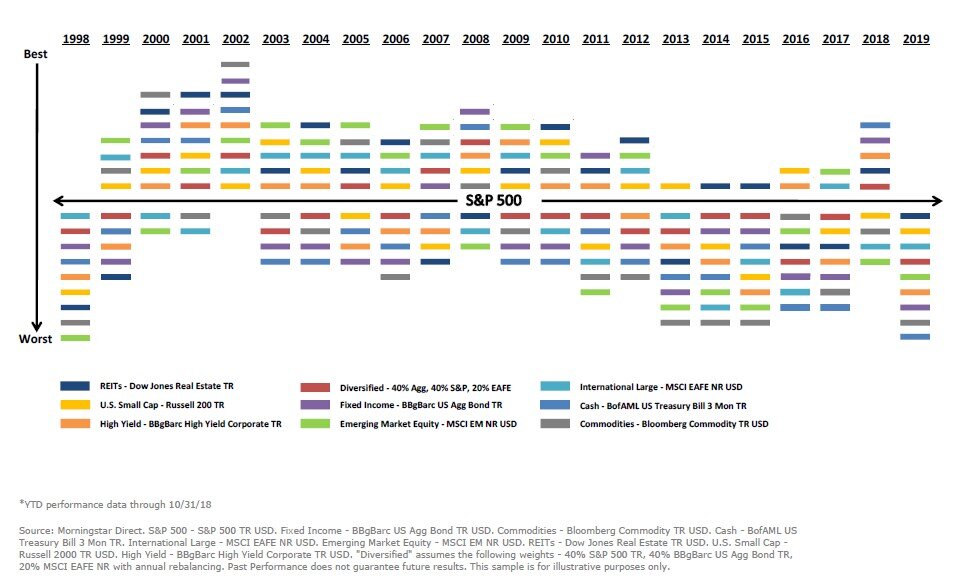
Let’s face it, the S&P 500 has consistently beat diversified portfolios since 2009.  Demonstrated below, a diversified portfolio of bonds, domestic stocks, and international stocks (crimson bar) was edged out by the S&P 500 nine of the last ten years. With the S&P’s winning streak, why would investors consider putting money to work anywhere else but US equities?

Center for Financial Planning Inc Investment Department

What The Fund?

For decades, investment professionals have preached the merits of portfolio diversification and asset allocation, but lately, performance hasn’t supported their conviction.  So why are investment professionals adamant about diversification? It began in 1952 when Harry Markowitz (a graduate student who became a

Nobel Prize winning economist) published an article in the Journal of Finance where he outlined the premise of his popularized Modern Portfolio Theory.  Essentially, the theory highlights the relationship between risk and reward for different types of investments. It then mathematically assesses investors’ ability to take on risks with performance expectations to create an optimal portfolio.  In other words, Markowitz laid the groundwork to help investors discover the right combination of investment products to achieve a certain level of performance without taking unnecessary risks.  

A Case for Portfolio Diversification

If you were looking to maximize portfolio growth over the last decade, you could have easily been tempted to scrap diversification in favor of the S&P 500.  Yet, there is evidence that Markowitz’s theory is still relevant for today’s investors. Craig L. Israelsen, PhD and Executive-in-Residence in the Personal Financial Planning Program at Utah Valley University, did compelling research around portfolio diversification worth reviewing. He compared five portfolios that represent different risks levels and asset allocations over 50-years, from 1970-2019.  While there is much to glean from his research, I’d like to zoom in on his comparison of two moderately aggressive portfolios because it shows the value of portfolio diversification. 

Center for Financial Planning Inc Investment Department

The first Moderately Aggressive Portfolio has a traditional 60% US Stock, 40% Bond asset allocation. The second Moderately Aggressive Portfolio has a 14.3% allocation to seven different asset classes.  In 2019, a year dominated by the S&P 500, the first portfolio (having a larger composition of the S&P 500) predictably outperformed the second portfolio.  On the other hand, over the 50-year period the second portfolio had similar annualized gross return with a lower standard deviation.  An investor in the second, 7-Asset Diversified Portfolio, had similar returns without taking as much risk as an investor in the first portfolio.  

There is another point worth spotlighting here.  Imagine if you only invested in the S&P 500, as represented by the Very Aggressive 100% US Stock portfolio, over that 50-year period. Compared with the 7-Asset Diversified Portfolio, the 100% US Stock portfolio had a 7% greater standard deviation for just under a percent greater return.  The diversified portfolio would have given you most of the return for half the headache.

Complex Portfolios for Complex Living

Investors don’t invest in a bubble or just for kicks.  In reality, investors use portfolios to serve needs and meet financial goals. Digging deeper into Israelsen’s research, he explores a real-life need and a common portfolio use: supplementing retirement.  His research evaluates a $250,000 initial investment for each portfolio over 26 rolling 25-year periods from 1970-2019 and assumes a 5% initial end-of-year withdrawal with 3% annual cost of living adjustment taken at the end of each year.

Center for Financial Planning Inc Investment Department

Again, looking at the two Moderately Aggressive Portfolios, the 60% US Stock, 40% Bond Portfolio had a median ending balance of $1,234,749 after 25 years compared to the 7-Asset Diversified Portfolio median ending balance of $1,806,565.  Likewise, if someone had aggressively invested in US Stock over that time, (s)he would still end up with less money than the diversified portfolio at $1,500.554.  This best illustrates why Modern Portfolio Theory (limiting risk through diversification) still matters.  Retirees want to avoid choppy investment experiences as they pull money from their accounts and create even returns through diversification that extend the longevity of their portfolios.

Pulling it all together, life is complex and investors use their investment portfolios to manage those complexities.  Investor needs and financial goals punctuate the necessity of investing in ways that diminish excessive risk-taking and extend the life of portfolios. Everything considered, risks mitigation through portfolio diversification stands true today, even for investors who’ve witnessed an S&P 500 tear over the last decade. 

Jaclyn Jackson is a Portfolio Administrator at Center for Financial Planning, Inc.® She manages client portfolios and performs investment research.


The foregoing information has been obtained from sources considered to be reliable, but we do not guarantee that it is accurate or complete, it is not a statement of all available data necessary for making an investment decision, and it does not constitute a recommendation. Any opinions are those of the author, and not necessarily those of Raymond James. Investing involves risk and you may incur a profit or loss regardless of strategy selected, including diversification and asset allocation. Keep in mind that individuals cannot invest directly in any index, and index performance does not include transaction costs or other fees, which will affect actual investment performance. Individual investor's results will vary.

The S&P 500 is an unmanaged index of 500 widely held stocks that is generally considered representative of the U.S. stock market. Standard deviation measures the fluctuation of returns around the arithmetic average return of investment. The higher the standard deviation, the greater the variability (and thus risk) of the investment returns.

Performance of hypothetical investments do not reflect transaction costs, taxes, or returns that any investor actually attained and may not reflect the true costs, including management fees, of an actual portfolio. Changes in any assumption may have a material impact on the hypothetical returns presented. Illustrations does not include fees and expenses which would reduce returns.

Print Friendly and PDF

The Importance of Staying Invested

Print Friendly and PDF
The+Importance+of+Staying+Invested

While trying to time the market may seem tempting during times of volatility, investors who attempt to, run the risk of missing periods of quality returns, likely leading to significant adverse effects on the ending value of a portfolio.

The image below illustrates the value of a $100,000 investment in the stock market during the 2007–18 period, which included the global financial crisis and the recovery that followed. The value of the investment dropped to $54,381 by February 2009 (the trough date), following a severe market decline. If an investor remained invested in the stock market over the next nine years, however, the ending value of the investment would have been $227,993. If the same investor exited the market at the bottom, invested in cash for a year, and then reinvested in the market, the ending value of the investment would have been $148,554. An all-cash investment at the bottom of the market would have yielded only $56,122. The continuous stock market investment recovered its initial value over the next three years and provided a higher ending value than the other two strategies. While all recoveries may not yield the same results, investors are well advised to stick with a long-term approach to investing.

The Importance of Staying Invested

Sometimes it can feel very difficult to stay invested!

Crises and Long-Term Performance

Economies and markets tend to move in cycles, and any stock market can have a downturn once in a while. Most investors lose money when the stock market goes down, but some people may think they can time the market and gain. For example, an investor may aim to buy in when the market is at the very bottom and cash out when the recovery is complete, thus enjoying the entire upside.

The problem with this type of reasoning is that it’s impossible to know when the market hits bottom. Most investors panic when the market starts to decline, then they decide to wait and end up selling after they have already lost considerable value. Or, on the recovery side, they buy in after the initial surge in value has passed and miss most of the upward momentum.

The graph illustrates the growth of $1 invested in U.S. large stocks at the beginning of 1970 and the four major market declines that subsequently occurred, including the recent banking and credit crisis. Panic is understandable in times of market turmoil, but investors who flee in such moments may come to regret it.

Each crisis, when it happens, feels like the worst one ever (the most recent one in 2008, as evidenced by the image, actually was). When viewed in isolation on the lower-tier graphs, each decline appears disastrous. However, historical data suggests that holding on through difficult times can pay off in the long run. For example, $1 invested in January 1970 grew to $117.05 by December 2018, generating a 10.2% compound annual return. And in the past, when looking at the big picture, every crisis has been eclipsed by long-term growth.

The Importance of Staying Invested

Please don’t hesitate to reach out to us when you are feeling uneasy during market volatility.  We are here, working for you!

Angela Palacios, CFP®, AIF®, is a partner and Director of Investments at Center for Financial Planning, Inc.® She chairs The Center Investment Committee and pens a quarterly Investment Commentary.


Returns and principal invested in stocks are not guaranteed. Stocks have been more volatile than bonds or cash. Holding a portfolio of securities for the long term does not ensure a profitable outcome and investing in securities always involves risk of loss. About the data: Stocks are represented by the Ibbotson® Large Company Stock Index. An investment cannot be made directly in an index. Four market crises defined as a drop of 25% or more in the index. Return is represented by the compound annual return. Recession data is from the National Bureau of Economic Research. The market is represented by the Ibbotson® Large Company Stock Index. Cash is represented by the 30-day U.S. Treasury bill. An investment cannot be made directly in an index. The data assumes reinvestment of income and does not account for taxes or transaction costs. Performance of a hypothetical investment does not reflect transaction costs, taxes, or returns that any investor actually attained and may not reflect the true costs, including management fees, of an actual portfolio. Changes in any assumption may have a material impact on the hypothetical returns presented. Illustration does not include fees and expenses which would reduce returns. The information contained in this report does not purport to be a complete description of the securities, markets, or developments referred to in this material. The information has been obtained from sources considered to be reliable, but we do not guarantee that the foregoing material is accurate or complete. Any opinions are those of Angela Palacios, and not necessarily those of Raymond James. Expressions of opinion are as of this date and are subject to change without notice. There is no guarantee that these statements, opinions or forecasts provided herein will prove to be correct. Investing involves risk and you may incur a profit or loss regardless of strategy selected. Keep in mind that individuals cannot invest directly in any index, and index performance does not include transaction costs or other fees, which will affect actual investment performance. Individual investor's results will vary. Past performance does not guarantee future results. Any information is not a complete summary or statement of all available data necessary for making an investment decision and does not constitute a recommendation.

The Single Most Important Investing Decision

Nicholas Boguth Contributed by: Nicholas Boguth

Most Important Investing Decision Center for Financial Planning, Inc.®

Unsurprisingly, I think investing is fun. This is one of the reasons I’ve chosen a career in investment management. With that being said, my career is only 6 years in. Is it possible that I only think investing is fun because the stock market has hit a new all‐time high every single year of my career? Do stocks ever fall? Why even own bonds that pay 2% coupons?

With the decade being over, and the S&P 500 rising almost 190% over the prior ten years, it seems like a good time to remind ourselves of a few key investing principles.

  • Stocks are risky. Their prices can fall.

  • Bonds are boring, but they have potential to help preserve your portfolio.

  • Asset allocation is the single most important investing decision you will make.

Asset allocation in its simplest form is the ratio of stocks to bonds in your portfolio. More stocks in your portfolio means more risk. More bonds in your portfolio means more potential to balance out the risk of stocks. As financial planners, one of the first decisions we’ll help you make is the decision of what asset allocation is most likely going to lead to your financial success.

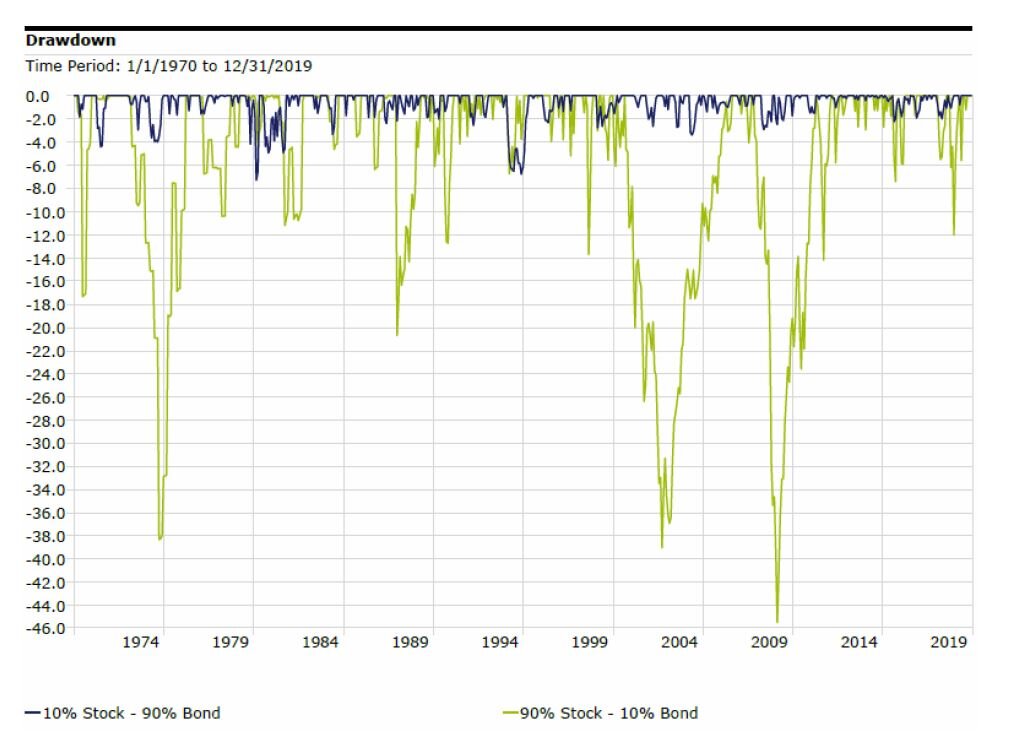
Take a look at the drawdowns of a portfolio of mostly stocks (green line) compared to a portfolio of mostly bonds (blue line). Stocks may have roared through the 2010’s, but no one has a crystal ball to tell us what they will do in the 2020’s. This chart is a good reminder of what stocks CAN do. Be sure that your portfolio is set up to maximize your chance of success no matter what stocks do. If you are unsure about your current portfolio, we’re here to help.

Source: Morningstar Direct. Stock index: S&P 500 TR (monthly). Bond Index: IA SBBI US IT Govt Bond TR (monthly).

Source: Morningstar Direct. Stock index: S&P 500 TR (monthly). Bond Index: IA SBBI US IT Govt Bond TR (monthly).

Nicholas Boguth is a Portfolio Administrator at Center for Financial Planning, Inc.® He performs investment research and assists with the management of client portfolios.


Investing involves risk and you may incur a profit or loss regardless of strategy selected, including diversification and asset allocation.

The information has been obtained from sources considered to be reliable, but we do not guarantee that the foregoing material is accurate or complete. The IA SBBI US IT Government Bond Index is an index created by Ibbotson Associates designed to track the total return of intermediate maturity US Treasury debt securities. One cannot invest directly in an index. Past Performance does not guarantee future results.

Investment Commentary: Fourth Quarter 2019

Center for Financial Planning, Inc.® Investment Commentary Fourth Quarter 2019

It’s a new decade, and there is much to discuss! We’d love to see you at our annual Economic and Investment Outlook event, happening Wednesday, February 5, from 11:30 a.m. to 1 p.m. We’ll review the past year and take a look at what to expect in 2020. Lunch will be provided. You can register here. If you are unable to attend, don’t worry! We’ll send a link to view the presentation afterward.

2019 in Review

Where’s the beef? 2019 will be remembered as the year of the meat alternative. Burger King introduced the “Impossible Whopper”. Fans raved that this meatless alternative tastes great (I’ll take their word for it). However, investors were not left wondering about the beef in the markets, as 2019 saw excellent returns for both bonds and stocks. 2019 was strong until early May, rallying from a 2018 Christmas Eve low over 25%. The old adage “sell in May and go away” would have worked for investors this year. Point-to-point, from early May to early October, the S&P 500 was down just under 2%. From October on, however, the markets rallied strongly through year-end. Here’s how they finished up for the year:

 
Center for Financial Planning, Inc.® Investments 2019 Market Returns
 

What spurred this strong rally?

The Federal Reserve Board (the Fed)

Interest rates were cut three times throughout 2019, with guidance from the Fed that future rate hikes were very unlikely, while inflation remained low. This was a complete turnaround from the Fed, increasing rates four times in 2018 to the point that the yield curve briefly inverted in early 2019. (The yield curve shows what interest bonds of the same credit quality with different maturity dates pay.) This meant that the yield on a 2-year U.S. Treasury bond was paying more interest than a 10-year Treasury bond. Since then, the yield curve has rapidly steepened as short-term interest rates moved back down. Cutting rates not only spurred bonds to a record year, but also provided a tailwind that lifted stock markets to higher levels. Remember the old saying “Don’t fight the Fed”? This means that when the Fed is reducing interest rates, markets tend to go up, and this year was no exception.

Trade wars

Markets have responded very favorably to the trade war de-escalation. China and the U.S agreed to the phase-one trade deal in December, removing significant unpredictability, at least in the near term. This agreement rolls back a portion of the existing tariffs and cancels the tariffs that were to be implemented on December 15, 2019. China also has committed to purchasing more agricultural products, goods, and services from the U.S. in the coming years. However, significant work remains to resolve the larger sticking points in the trade war. This will likely be a factor influencing market performance and volatility in the coming year.

Corporate Buybacks

Over the course of the business cycle, the contribution to equity returns from corporate share buybacks ebbs and flows. Companies frequently buy back their own shares with the firm’s profits. This will increase Earnings Per Share (EPS), because the company’s earnings are divided among fewer shares, and it becomes a way to potentially increase stock prices.

Post-recession, companies tend to have less expendable cash and tend to buy back fewer shares. Later in the business cycle, they become cash rich and are able to more heavily deploy funds. This business cycle is no exception. Share buybacks throughout 2018 and 2019 have been a contributor to growth in EPS for companies. The one time allowance of corporate funds repatriation at a lower tax rate (allowed by Trump’s tax reform) has, no doubt, boosted this a bit.

The chart below shows the growing percentage of share buy backs. Twenty-eight percent of corporate cash on hand was utilized for this in 2018 and 2019, versus only 21% in 2010. Also notable, is the growing pool of cash (total height of the bar each year) for S&P 500 companies.

 
Source: Bloomberg, Compustat, FactSet, Standard & Poor’s, J.P. Morgan Asset Management

Source: Bloomberg, Compustat, FactSet, Standard & Poor’s, J.P. Morgan Asset Management


Impeachment threatened to derail the 2019 stock market rally

The House of Representatives formally voted to Impeach President Trump in December, which the markets largely anticipated. Now, the House is preparing to send the Articles of Impeachment to the Senate and begin trial there. The Republican-controlled Senate is expected to acquit President Trump. If the vote goes as expected, it should not have an impact on markets. I see this as the most likely scenario.

What do we expect for 2020?

Election year

As 2020 ramps up, so will the political campaigns. The chart below looks at the S&P 500 performance during election years. The story is largely one of positive returns. In previous years, 6- and 12-month returns ahead of a presidential election have been positive almost 90% of the time.

Center for Financial Planning, Inc.® Investment Commentary Fourth Quarter 2019

Our economic indicators support moderate growth, and markets are playing out in a positive manner, but we are watching a few points of worry.

U.S.-Iran tensions increase

The markets took a hit during the first week of January, after a move by President Trump. In response to Iran’s latest threat, Trump targeted Iran’s top general Qasem Soleimani, ultimately killing him in a U.S. air strike. This marks a departure from the nonmilitary approach the president has taken with the rest of the world, and caused the markets to quickly pull back. We’ll be watching the escalation of this geopolitical risk. 

After studying markets during other overseas military conflicts, we see the stock market flare up at the beginning of each conflict, when uncertainty is at its greatest. Once a course of action is decided, markets tend to settle into a general growth pattern, if the overall economy remains strong. This holds true even if that action is U.S. military invasion, which may seem counter intuitive. During this tension, many investors chose bonds as their safe haven. Oil is expected to spike and put some upward pressure on inflation. However, the amount of oil we can supply ourselves could mute this impact.

Economic Highlights:

  • Unemployment remains at 50 year lows at 3.5%.

  • Inflation, as measured by the PCE Price Index, rose 1.6% over the year ending November 2019.

  • Gross Domestic Product (GDP) rose 2.1% in the third quarter, exceeding expectations.

  • Retail sales increased 3.3% year over year, with online sales leading the growth – signs of a healthy consumer.

  • U.S. dollar strength continues, bolstered by low inflation and low interest rates.

Economic Lowlights:

  • ISM Manufacturing Index declines to 48.1. Any reading below 50 indicates contraction and is a potential recessionary signal.

  • Consumer Confidence Index softens from reaching all-time highs, leaving us to wonder whether the consumer will continue to buy goods and services at the same pace (which boosts GDP).

  • While leading indicators softened in the fall, the most recent reading leveled off. A negative trend here can signal a coming recession, but this softening hasn’t yet pushed us into the camp of calling for recession.

2019 was a strong year for U.S. markets. We predict positive returns will continue, just not at the same pace we experienced last year. At this point, we don’t expect a recession this year, but companies will likely face challenges as the Trade War continues. The 2020 election will continue to be on our minds as a party change in the White House could bring new economic policies.

As we welcome the New Year, we don’t want to miss the opportunity to express our gratitude for the trust you place in us each and every day. Thank you! Have a wonderful 2020!

On behalf of everyone here at The Center,

Angela Palacios, CFP®, AIF®
Partner & Director of Investments

Angela Palacios, CFP®, AIF®, is a partner and Director of Investments at Center for Financial Planning, Inc.® She chairs The Center Investment Committee and pens a quarterly Investment Commentary.


There is no guarantee that these statements, opinions or forecasts provided herein will prove to be correct. Past Performance does not guarantee future results.

One cannot invest directly in an index. The S&P 500 is an unmanaged index of 500 widely held stocks that is generally considered representative of the U.S. stock market. The MSCI EAFE (Europe, Australasia, and Far East) is a free float-adjusted market capitalization index that is designed to measure developed market equity performance, excluding the United States & Canada. The EAFE consists of the country indices of 22 developed nations. The Russell 2000 Index measures the performance of the 2,000 smallest companies in the Russell 3000 Index, which represent approximately 8% of the total market capitalization of the Russell 3000 Index. The Bloomberg Barclays US Aggregate Bond Index is a broad-based flagship benchmark that measures the investment grade, US dollar-denominated, fixed-rate taxable bond market.

The information has been obtained from sources considered to be reliable, but we do not guarantee that the foregoing material is accurate or complete.

Great Expectations

Nicholas Boguth Contributed by: Nicholas Boguth

Great Expectations Center for Financial Planning, Inc.®

We hear a lot about how stocks perform “on average”, and what to “expect” from stock returns:

  • “On average, stocks return x%.”

  • “You can expect stocks to return x% over the long run.”

  • “We expect stocks to return x% per year.”

But what to expect and what is average are two very different things. In fact, average happens so rarely, that I would almost never expect the average. Let’s take a look at some numbers.

Below is a chart of one-year rolling returns for the S&P 500 since 1936. Every spot on that line represents the prior 12 months of returns. As you can see, it is quite sporadic. The “average” return for this set of data is +11.9%, but it ranges from -50% to more than +61%!

Return data from Morningstar Direct

Return data from Morningstar Direct

When it comes to investing, realistic expectations are very important.

They keep us grounded and help us keep emotions out of the decision-making process. Don’t expect average returns every time you look at your stocks. Statistically speaking, since two standard deviations capture ~95% of data, it is safe to say you can expect somewhere between two standard deviations on any given period. If you are looking at one-year returns, that would be between -23% and +47%.

It is also important to remember your time horizon. Expectations over one year should be very different than expectations over 30 years. For reference, the entire range of 30-year returns for the S&P 500 since 1936 is between +9.1% and +14.7%.

S&P 500 TR index, monthly returns, 3/31/1936 to 10/31/2019

S&P 500 TR index, monthly returns, 3/31/1936 to 10/31/2019

Lastly, we need to remember that this is only one asset class. If you have a diversified strategy, there is a good chance that large U.S. companies only make up a small percentage of your strategy. International companies, small and mid-sized companies, various bonds, and alternative strategies all merit different expectations. As financial advisors, it is our job to help you understand what to expect. Not sure what to expect? Give us a call.

Nicholas Boguth is an Investment Research Associate at Center for Financial Planning, Inc.® He performs investment research and assists with the management of client portfolios.


Return data from Morningstar Direct. S&P 500 TR index, monthly returns, 3/31/1936 to 10/31/2019. Any opinions are those of Nicholas Boguth, Investment Research Associate, and not necessarily those of Raymond James. Expressions of opinion are as of this date and are subject to change without notice. There is no guarantee that these statements, opinions or forecasts provided herein will prove to be correct. Investing involves risk and you may incur a profit or loss regardless of strategy selected, including diversification and asset allocation. Keep in mind that individuals cannot invest directly in any index, and index performance does not include transaction costs or other fees, which will affect actual investment performance. Individual investor's results will vary. Past performance does not guarantee future results. Future investment performance cannot be guaranteed, investment yields will fluctuate with market conditions. The S&P 500 is an unmanaged index of 500 widely held stocks that is generally considered representative of the U.S. stock market. International investing involves special risks, including currency fluctuations, differing financial accounting standards, and possible political and economic volatility.