Investment Planning

US GDP Unexpectedly Gives a Negative Reading

Print Friendly and PDF

As the U.S. Market entered correction territory (down 10%), another warning sign entered the state of the economy. Gross Domestic Product (GDP) for the first quarter fell at a 1.4% annualized pace. The definition of a recession is two consecutive quarters of negative GDP growth. Below is a great visual of the makeup of GDP growth this past quarter, so we can dive deeper into what is making up the negative number.

Source: Washington Post

The consumer continued to hold up its end of the bargain fairly well, contributing to nearly 2% of GDP growth as shown by personal consumption. But much of the drag this quarter came from an excessive amount of net exports (pink area), which are a negative drag to GDP. These imports were the largest ever on record this quarter as businesses worried about Russia’s invasion of Ukraine and front-loaded their imports. Also, consider that we are comparing against quarter 1 of 2021, which had a direct cash infusion by the Federal Reserve into consumers’ bank accounts. This quarter’s reading encompassed bad news like the Russia-Ukraine conflict and the biggest spike in covid cases ever here in the U.S.

All of this negative news has weighed on investor sentiment. This reading is typically a contrarian indicator, the AAII Investor Sentiment Survey, but has recently registered the worst reading since 1992. Readings were not this bad during the 2008/2009 financial crisis! Usually, a reading like this is contrarian because a market bounce generally follows it to the upside. 

So, which indicator do you follow to make investment decisions? Often we get mixed signals from markets. It is best to determine what is important to pay attention to and what might be noise so that you can have an action plan built ahead of time during periods of stress. This is no easy task and is one of the main mistakes made by do-it-yourself investors. Planning is in our name, and the importance never diminishes. If you have questions and need to speak with someone, don’t hesitate to reach out to us!

Angela Palacios, CFP®, AIF®, is a partner and Director of Investments at Center for Financial Planning, Inc.® She chairs The Center Investment Committee and pens a quarterly Investment Commentary.

The forgoing is not a recommendation to buy or sell any individual security or any combination of securities. Be sure to contact a qualified professional regarding your particular situation before making any investment or withdrawal decision. The information contained in this blog does not purport to be a complete description of the securities, markets, or developments referred to in this material. The information has been obtained from sources considered to be reliable, but we do not guarantee that the foregoing material is accurate or complete. Any opinions are those of Angela Palacios, CFP® AIF ®and not necessarily those of Raymond James. Expressions of opinion are as of this date and are subject to change without notice. There is no guarantee that these statements, opinions or forecasts provided herein will prove to be correct. Investing involves risk and you may incur a profit or loss regardless of strategy selected. Individual investor's results will vary. Past performance does not guarantee future results. Investments mentioned may not be suitable for all investors.

Why Everybody Is Talking About ESG Investing

Jaclyn Jackson Contributed by: Jaclyn Jackson, CAP®

Print Friendly and PDF

*This blog was originally published on April 8, 2021. For more information on matching your values to your investments, check out The Center Social Strategy.

According to CNBC, almost 1 in 4 dollars is going into Environmental, Social, and Governance (ESG) funds this year.  Even before 2021, the combination of ethical provisions and competitive performance turned many heads towards ESG investments.  I aim to explain what the big fuss is about and why ESG investments are gaining traction.

Investors Are Talking About It

To be clear, the March 2020 downturn was no picnic (for anyone).  However, investors who had stake in environmental, social, and governance (ESG) investments managed the economic downturn with greater resilience.  Leading research firm, Morningstar, reported that during March 2020, “sustainable funds dominated the top quartiles and top halves of their peer groups.  Sixty-six percent of sustainable equity funds ranked in the top halves of their respective categories and more than a third (39%) ranked in their category's best quartile.”  Compared to peers, ESG funds pulled top rankings.

Not only did peer to peer comparisons look good, but index comparisons proved more robust too.  In the same study, Morningstar compared 12 passive ESG funds in the large-blend category to a traditionally passive fund. They reported, “For the year through March 12, all 12 ESG index funds outperformed”. What’s more is that fees were included in this study.  While the ESG passive funds compared were more expensive than the traditional passive fund, they still managed to outperform.  Impressively, the trend held with international and emerging market index comparisons…and everybody is talking about it! 

Including the world’s largest investor/asset manager, BlackRock, who’s CEO challenged corporations to consider the impact of climate change on business models.  In 2020, CEO Larry Fink announced BlackRock would incorporate ESG metrics into 100% of their portfolios.  The asset manager also pledged to produce data and analytics to punctuate why considering climate change should be an investment value. 

Yellen And Powell Are Talking About It

Investors are not the only people concerned.  In wake of recent natural disasters, Treasury Secretary Janet Yellen and Federal Reserve Chairman Jerome Powell are working to assess the risks climate change poses to the health and resilience of the financial system.  Their consensus implied a concentrated effort to monitor financial institutions and their exposure to extreme weather events.  Leading the charge, Fed Governor Lael Brainard, recently announced the Financial Supervision Climate Committee (FSCC).  Brainard is a proponent of using scenario testing to understand banks’ ability to survive hypothetical climate catastrophes.  The FSCC will focus on developing evaluation processes for climate risks to the financial system.

Why Everybody Is Talking About It

While many people acknowledge the ethical appeal of ESG methodologies, they may not fully appreciate the businesses appeal that underpins stock performance.  Business litigation risk provides a clear example.  The Financial Analyst Journal featured a study that explored the relationship between ESG performance and company litigation risks.  Analyzing US class action lawsuits, researchers found, “a 1 standard deviation improvement in the ESG controversies of an average company in the sample reduced litigation risk from 3.1% to 2.4%”.  The study also asserted that companies with low ESG performance experienced market value losses ($1.14 billion) twice the size of companies with high ESG performance.  Further, the study integrated their findings with a trading strategy and concluded investors benefitted from lower litigation risk.

It doesn’t stop with litigation risk.  There are also links between healthy corporate governance and market returns.  As You Sow, a nonprofit promoting corporate responsibility, has been tracking S&P 500 companies with excessively compensated CEOs since 2015.  They collaborated with R. Paul Herman, CEO of HIP Investor Inc., to do performance analysis based on their tracking. Herman determined, “…shareholders could have avoided lagging returns by excluding companies that keep making the list for excessive CEO pay”.  Companies without excessively paid CEOs significantly outperformed companies with excessively paid CEOs.  The former generated 5.6% in annualized returns compared to the latter at 1.5%.  What’s astonishing is that the report noted, “The performance gap due to excessive compensation equates to approximately $223 billion in shareholder value lost.”  How are companies without overpaid CEOs edging out competitors?  Instead of overpaying CEOs, more resources can be dedicated to research and development projects, dividends to shareholders, or equitable pay for employees; things that advantage company profits and support positive investor outcomes.

Are You Talking About It?

There is definitely a case for the merits of ESG investing.  It is no wonder folks are talking about it.  Are you interested in the conversation?  If you’ve followed trends in ESG investing and are considering adapting ESG strategies into your portfolio, The Center is here to help.  Ask your advisor about the Center Social Strategy; they would be happy to talk about it with you.

Jaclyn Jackson, CAP® is a Senior Portfolio Manager at Center for Financial Planning, Inc.® She manages client portfolios and performs investment research.

This material is provided for information purposes only and is not a complete description of the securities, markets, or developments referred to in this material. Any opinions are those of the author and not necessarily those of Raymond James. There is no guarantee that the statements, opinions or forecasts provided herein will prove to be correct. Investing involves risk and you may incur a profit or loss regardless of strategy selected. Utilizing an ESG investment strategy may result in investment returns that may be lower or higher than if decisions were based solely on investment considerations. The S&P 500 is an unmanaged index of 500 widely held stocks that is generally considered representative of the U.S. stock market. Keep in mind that individuals cannot invest directly in any index, and index performance does not include transaction costs or other fees, which will affect actual investment performance. Individual investor's results will vary. Past performance does not guarantee future results.

Battle of the Brackets…Portfolio Management Edition: A Center Spin-Off Competition

Nicholas Boguth Contributed by: Nicholas Boguth, CFA®

Print Friendly and PDF

I believe certain things make our team outstanding here at The Center, and a few of them were in the spotlight this past month amid the March College Basketball Tournament:

In the spirit of education, teamwork, and some friendly competition, we ran a bracket competition with an investment focus (we did a normal bracket game too, but mine was busted the first day, so there is no need to talk about that). Every team member chose an asset class to represent their “team” in the tourney. The winner of each round is the asset class that outperformed over the week, and we are repeating for five weeks until we have our champion.

Some team members chose more stable asset classes like short-term U.S Treasuries or investment-grade bonds, while some chose more volatile options like Emerging Market stocks or commodities. Overall, it is fun for the entire team to collaborate and for all of us (not just those in investment roles) to watch how different asset classes move with economic news*.

*We all know there is no shortage of economic news lately from the U.S. and overseas. Markets have been volatile, and times like these stress the importance of having a plan in place. As always, we are here to help answer any questions you may have about your plan. One small but powerful tool in investment management that we have taken advantage of is tax-loss harvesting during volatile markets. Read more about that here.

The cherry on top of this competition is that we are playing for some of our favorite local charities. The Center’s Charitable Committee donated $1,000 to the winning four team members’ charities of choice. Check out the results from last year, as we ran the same competition using individual stocks instead of asset classes. We will continue to find new ways to collaborate, learn, and partner with charities here at The Center. We hope you follow our blog as we update along the way!

Nicholas Boguth, CFA® is a Portfolio Manager at Center for Financial Planning, Inc.® He performs investment research and assists with the management of client portfolios.

Any opinions are those of Nicholas Boguth, CFA® and not necessarily those of Raymond James. Every Investor’s situation is unique and you should consider your investment goals, risk tolerance and time horizon before making any investment, Prior to making an investment decision, please consult with your financial advisor about your individual situation.

Tips for Investors During Times of Market Volatility

Print Friendly and PDF

When faced with volatility in the market, emotions can be triggered in investors that can impact their judgment and potentially affect returns. These pullbacks can make folks want to pull up stakes and run – a reaction that is often a mistake, especially for long‐term investors.

The likelihood that we will continue to see volatility this year is high. The Fed has slowed down its bond buying activities and is raising interest rates, the threat of a new COVID variant that could shut down the economy still exists, and there are supply chain and labor issues around the globe. To top it all off, we are gearing up for mid‐term elections in November.

Here are some tips to consider when we do face a volatile market. Having a plan during this time can help provide clarity, confidence, and even strategies to take advantage of the volatility.

  • First, we need to remember that market volatility is normal. As investors, when we experience long periods of upward markets with little volatility, we forget how regular market volatility really is. We need to remember that historically, the market will dip by 5% at least three times a year. Also, on average, the market will have a 10% correction once a year. Understanding that volatility is a natural process of investing and challenging to avoid can help curb some emotions triggered by these markets.

  • Make sure your employer retirement accounts are rebalanced appropriately. Over the last few years, money invested in stocks have severely outperformed the bond market. Now is a good time to revisit the allocations in your Employer‐Sponsored Retirement plans to make sure your allocation is still within your risk tolerance. You will want to make sure that your allocation to stock funds and bonds funds is appropriate for the amount of risk you want to take. If you are unsure of how you should

  • Increase Plan contributions when markets are down. For younger investors still in the accumulation stage, a volatile market is a great time to increase your contributions. Though it may seem scary to increase your contributions when markets are volatile, you are actually buying into the market when prices are on sale. Contributions added when the market is down 5‐10% from the previous high have much more earning power than contributions made when the market is up 5‐10% from its last high.

  • Have additional cash on hand to invest in dips and corrections. For investors who have been able to max out their Employer‐Sponsored plans and still have additional cash to invest, a volatile market can make for an excellent opportunity to do so. Consider talking with your advisor about moving extra cash to your investment accounts to invest on dips and corrections. Together, you can develop a strategy to get your cash invested over time or all at once, depending on market conditions.

Stumbling through bad times without a strategy makes a troubling situation even worse. If you do not have a retirement or investment plan, you will not accurately assess the damage when markets do take a dive. This could increase stress and cause investors to make bad decisions.

These periods of volatility are an opportunity to connect with your advisor, enabling them to act as a sounding board for your concerns. By talking about current events in light of your overall financial plan, your advisor can provide a reassuring perspective to help you stay the course or even invest extra cash during an opportune time.

Michael Brocavich, MBA is a CERTIFIED FINANCIAL PLANNER™ professional at Center for Financial Planning, Inc.® He has an extensive background in both personal and corporate finance.

Investing involves risk and you may incur a profit or loss regardless of strategy selected, including diversification and asset allocation. The information has been obtained from sources considered to be reliable, but we do not guarantee that the foregoing material is accurate or complete. Past Performance does not guarantee future results.

Tax Diversification and Investment Diversification: The Limitations of Asset Location

The Center Contributed by: Center Investment Department

Print Friendly and PDF

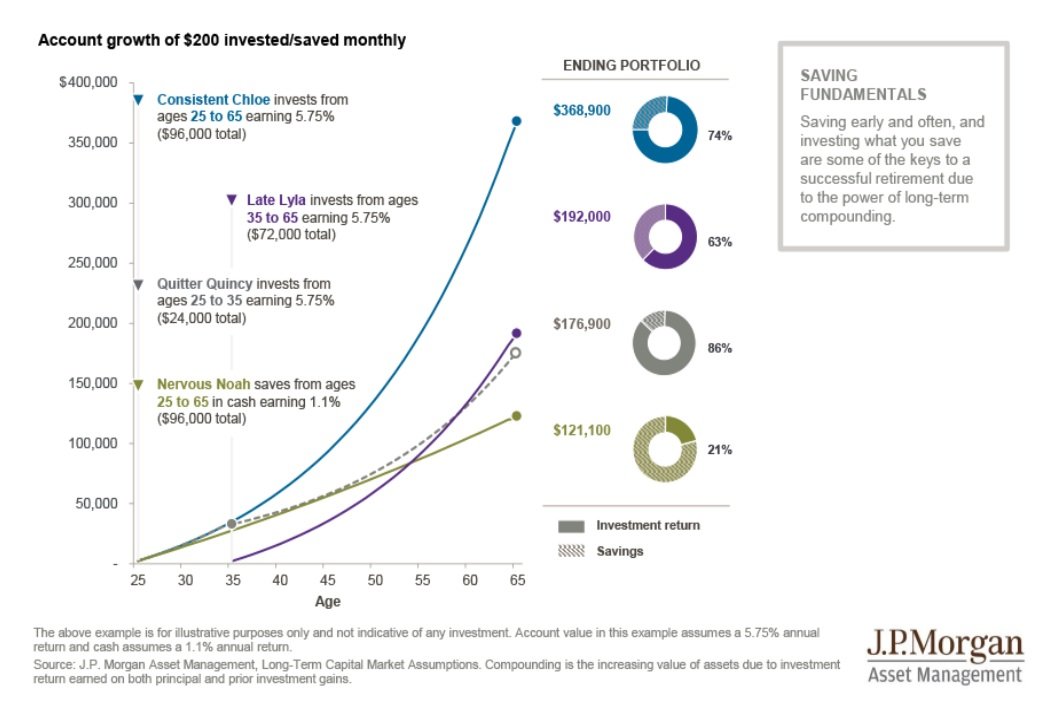
Taxes throughout your lifetime are nearly impossible to predict, so tax diversification is almost as important as the decision to save itself. Taxes are the biggest enemy to retirement and one of your single most significant costs. Therefore, when you are establishing your career, your younger years are the most impactful time to start saving, as shown by the chart below. In this hypothetical example, an investor starting young (Consistent Chloe) has the potential to accumulate far more – teal colored line and ending portfolio value - than a person who waits until age 35 (Late Lyla) – purple colored line and ending portfolio value - to start saving.

Our younger years also offer us a unique opportunity to save in a Roth IRA (tax-free savings) account; however, this is when we are least likely to think of expanding our retirement income options. What if that growth you see in the example above happened all in a tax-free account? This can help you dodge the bullet of taxes later in life.

As we mature in our careers, our income (and tax brackets) naturally increase, and it often becomes more important to invest within tax-deferred accounts. In turn, this gets us tax deductions today that were not always important before.

In our later stages of saving, perhaps when considering early retirement or before social security and Medicare kick in, we would need to start saving into our taxable account buckets to have money readily available for current expenses. This would bridge the gap if accessing our tax-deferred buckets (usually the largest portion of our assets) come with too many strings attached, such as early withdrawal penalties.

So, we know it is important to save and diversify our tax buckets for savings, but are there differences in how we should diversify those asset buckets?

We have all heard that asset location can also be an important tool for diversification. This means placing portions of our investments in certain accounts because of the additional tax benefits that it provides. For example, placing taxable bonds in your tax-deferred accounts to shelter the ordinary income they spin-off or focusing on equities for high growth in our Roth accounts. This makes a lot of sense for someone in the accumulation stage; however, there needs to be even more careful thought applied for someone in or nearing retirement.

There is also such thing as too much of a good thing. Going to extremes and putting all of your bonds in tax-deferred accounts or all of your most aggressive positions in your Roth accounts can lead to some significant shortcomings. Diversifying your investments by tax buckets is important because it gives you the flexibility in any given year to draw from a certain tax profile based on your current situation and cash flow needs. What if you want capital gains only? Take from taxable investments. Need to remodel your house and take a large withdrawal but doing so could push you into a higher cap gains bracket? Take from your Roth. But what if you need to take from that Roth IRA and the markets have corrected 25% that year? In this case, you might be hesitant to take the money out because you want to give it time to experience the rally back that may be on the horizon. You get the picture of where issues could arise. Asset location is a great tool to mitigate taxes, but always be aware that some diversification may always be appropriate in each tax bucket.

It is important to properly diversify on many different levels, and a financial planner can help you do just that. If you have any questions on this topic or others, don’t hesitate to reach out!

The foregoing information has been obtained from sources considered to be reliable, but we do not guarantee that it is accurate or complete, it is not a statement of all available data necessary for making an investment decision, and it does not constitute a recommendation. Any opinions are those of the author and not necessarily those of Raymond James. While we are familiar with the tax provisions of the issues presented herein, as Financial Advisors of RJFS, we are not qualified to render advice on tax or legal matters. You should discuss tax or legal matters with the appropriate professional. Examples used are for illustrative purposes only.

2021 Fourth Quarter Investment Commentary

The Center Contributed by: Center Investment Department

Print Friendly and PDF

As we close the books on 2021 and move into 2022, we took a few minutes to re-read our thoughts as we started the year. There was a sense of hope that the recovery would continue, jobs would recover, and the world would start to normalize. There was also worry over finalizing the election and concerns of tax rate increases. While it has been a bumpy road, the year has ended better than where we began in some very important aspects like job recovery and dodging the bullet of widely higher taxes. We do have a fresh batch of worries but also optimism looking ahead to 2022.

A diversified benchmark portfolio consisting of 60% stocks (split 40/20 between U.S.-S&P 500 and International-MSCI EAFE) and 40% bonds (Bloomberg Barclays U.S. Aggregate Bond Index) is up just over 12.5% for 2021, with the S&P 500 again leading the way at +28.71%, international stocks (MSCI EAFE) at +11.78%, and U.S. Aggregate Bonds at -1.54%. Please keep in mind indices are not available for direct investment. Any investor who attempts to mimic the performance of an index would incur fees and expenses which would reduce returns.

The good news is, for yet another year, the above hypothetical diversified portfolio would be up well over any targets we may have designed with you toward meeting financial planning goals; which should be an investor’s ultimate long term target.

Should we continue to diversify your portfolio?

Investors everywhere have been left wondering, “Why don’t I just own more U.S. stocks if they are producing such stellar returns this year while everything else (bonds or emerging) has produced very ho hum to negative results?” During these times, it is important to open our history books and remember the “lost decade.” 

We are referring to the 10 year time period throughout the 2000’s when the S&P 500 produced a negative total return. This was a very difficult time period starting with the burst of the dot-com bubble and ending with the financial crisis of 2008. Many felt like there was nowhere to hide during this time period. In reality however, those with a widely diversified portfolio had quite the opposite results. Sure a portion of their portfolio was flat to down but many of the other areas of their portfolio performed quite well over this decade, boosting their overall portfolio returns. The chart below illustrates average annual returns from some of the major Morningstar categories from 2000-2009.  The lost decade only applied to one type of investment one could own.

Chart and data courtesy John Hancock® Investments

The Center has a long history, being founded in 1985, so we have the benefit of guiding clients through many types of return environments. Coming into this lost decade, investors were asking us the very same questions we are hearing now, and the chart above shows us how that ended. While we don’t believe we are on the doorstep of another lost decade, we do feel it is not the time to abandon diversification. So, when you open your statements this year, you may see other well-known strategies that are roughly 60% Stock/40% bond up even less at just below 10% for the year. So, be careful before making any drastic changes to your portfolio. Talk to your financial planner first to determine how this might impact your long term goals!

What about Inflation?

People are saving less and spending more. Prior to the pandemic the savings rate, according to the Bureau of Economic Analysis, was roughly 7.5%, spiked up to almost 34% at the start of the pandemic in April 2020, and is now back down to 7.5%. With that large savings round trip, however, cash in bank accounts is still very high. Roughly $3.3 trillion of extra cash has accumulated in bank accounts by Americans (source: Longview Economics). All of this extra cash has served as fuel for inflation. As of the end of November, inflation readings hit a 40 year high of 6.8%. Food and energy were the main drivers of these readings. As stimulus slows, we should see spending (demand) in both of these areas level off and even decline a bit.

The Federal Reserve is now taking active measures to try to combat inflation. If you look at the history of interest rates, we have been very low for a long time. The Federal Reserve under chairs, Yellen and Powell, started to creep them back upwards as we emerged from the financial crisis. Then the pandemic struck and The Fed took them right back down near zero. Now the forecast is to start increasing rates again.

The last time we saw inflation at the levels we are at now was back in the early 1980’s. At that time, interest rates were quite high to try to bring inflation down. Sometimes we get the question of why increasing interest rates help to combat inflation. We love this question because it brings us back to the basics of economics!

Inflation is a result of too much money chasing too few goods. Right now, we have both scenarios of this equation playing out. Too much money (remember the paragraph above where we reference how much money households are holding?) chasing too few goods caused by supply chain disruptions. The basic recipe for inflation is in place. You also compound this by the base of comparison; inflation was next to nothing in 2020, teetering on the verge of deflation because no one was spending money. This is called demand-pull inflation for you economics nerds out there. There is also cost-push inflation happening and wages rising for lower income households. This also increases the price of goods and services (higher costs pushing prices higher).

So if low interest rates (cheap borrowing) and government stimulus has put money into our hands to spend and cause inflation, higher interest rates (more expensive borrowing) and no more government handouts should start to take money out of our hands for spending and therefore slowing the rate we buy things. With less demand comes lower prices or at least prices that rise at a slower pace. This is a long and slow process though. These moves by the Federal Reserve do not accomplish the task overnight. Higher interest rates take months to years to filter their way into the economy and slow inflation. Other forces may be present to help curb inflation in the new year as well. Our basis of comparison is going to rise steadily throughout 2022 and supply chain disruptions should start to ease.

Stocks are expensive.  Is now a bad time to buy?

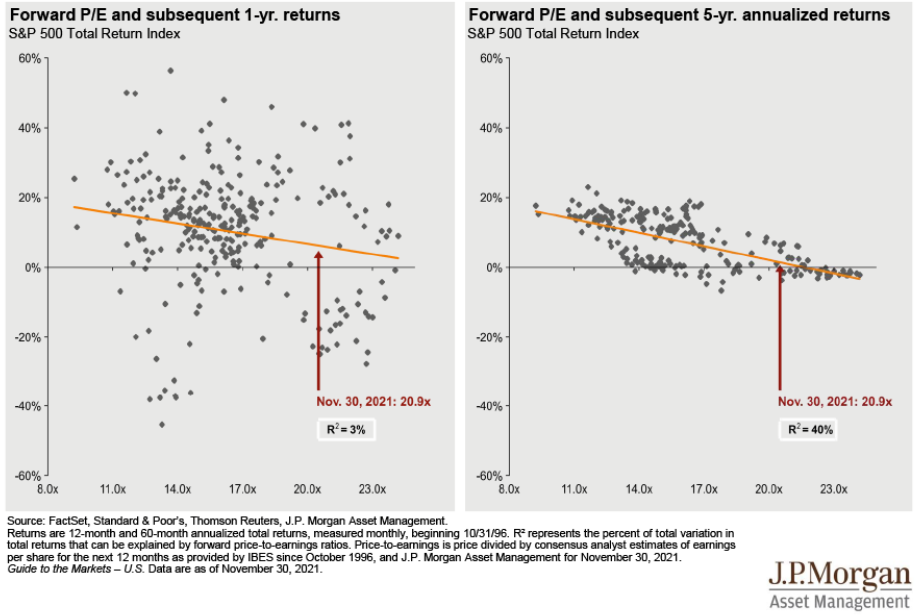
Stocks were expensive at the start of last year too, but if you avoided the S&P 500 last year then you missed out on over 28% of returns. Valuations are not everything when it comes to stock returns, and trying to time the market rarely works in investors’ favor. We are not market timers, but we do monitor the yield curve, leading economic indicators, and various commentary resources for determining our outlook for equities and bonds. Right now, our signals are still saying neutral stocks to bonds. Our research has also found that forward market performance is not correlated highly with P/E ratios.

The below chart shows how uncorrelated valuations are as a short term indicator. Sometimes, with this reading as of November 30th, the market has been up 20-40% (gray dots above the orange line in the left hand chart) one year out and sometimes it has been down 20-30% (gray dots below the orange line in the left hand chart).  Five year forward returns were all positive and in most cases positive by more than 5-6%.

International valuations are the opposite story and have been for a long time too, yet they continue to underperform.  We continue to hold them as part of the allocation because of the compelling valuation story and importance of diversification. This chart is interesting because it shows how long you can be wrong making an investment call purely on valuation. The ACWI ex-US looked like a good deal versus the U.S. 10 years ago and we know how that story has ended.

The final thing we would like you to remember if you find yourself asking “is now a bad time to buy?” is that if your portfolio is diversified, then large U.S. stocks will only make up a portion of your portfolio. In a diversified 60/40 portfolio for instance, S&P 500 stocks might only make up ¼ of your total portfolio. The other asset classes should provide different return streams or even buffer the portfolio in the event of a U.S. stock market decline. Stick to your plan, rebalance according to it, and avoid making all-in or all-out decisions that could impair your financial future.

Looking forward to 2022

We should start to see interest rates increase and, therefore, we are favoring shorter duration bonds in portfolios for now. We want to continue to let your bonds be bonds and your stocks be stocks. Bonds continue to be an important portion of your portfolio to serve as a volatility dampener while we leave our equities free to generate returns needed to achieve your financial planning goals.

The CDC is relaxing quarantine guidelines as more and more information becomes known about transmutability of the virus. This should serve to start relaxing supply chain disruptions caused by virus spikes hopefully alleviating the transitory portion of inflation. Part of the reason the U.S. performed so strongly in 2021 was a continuation of the re-opening story. We resisted further economic shutdowns despite new waves of Covid outbreaks. Overseas was a different story as outbreaks brought continued sporadic shutdowns. As immunities build and the virus continues to (hopefully) evolve into weaker strains, we should see less of this supporting stronger rallies with overseas markets.

If you are interested in hearing more about our forward-looking views, join us in February for our Economic and Investment Outlook Event. Stay tuned for details in the upcoming weeks.

Remember, we are here to help you meet your investment goals, so feel free to reach out to the investment team or your planner anytime for support. On behalf of the entire Center Team, we wish you a wonderful 2022.

Any opinions are those of the author and not necessarily those of Raymond James. The information contained in this report does not purport to be a complete description of the securities, markets, or developments referred to in this material. There is no assurance any of the trends mentioned will continue or forecasts will occur. The information has been obtained from sources considered to be reliable, but Raymond James does not guarantee that the foregoing material is accurate or complete. Any information is not a complete summary or statement of all available data necessary for making an investment decision and does not constitute a recommendation. Investing involves risk and you may incur a profit or loss regardless of strategy selected. The S&P 500 is an unmanaged index of 500 widely held stocks that is generally considered representative of the U.S. stock market. The MSCI EAFE (Europe, Australasia, and Far East) is a free float-adjusted market capitalization index that is designed to measure developed market equity performance, excluding the United States & Canada. The EAFE consists of the country indices of 22 developed nations. The Bloomberg Barclays US Aggregate Bond Index is a broad-based flagship benchmark that measures the investment grade, US dollar-denominated, fixed-rate taxable bond market. Keep in mind that individuals cannot invest directly in any index, and index performance does not include transaction costs or other fees, which will affect actual investment performance. Individual investor's results will vary. Past performance does not guarantee future results. Diversification and asset allocation do not ensure a profit or protect against a loss. Dividends are not guaranteed and must be authorized by the company's board of directors. Special Purpose Acquisition Companies may not be suitable for all investors. Investors should be familiar with the unique characteristics, risks and return potential of SPACs, including the risk that the acquisition may not occur or that the customer's investment may decline in value even if the acquisition is completed. Investing involves risk and you may incur a profit or loss regardless of strategy selected. Past performance is not a guarantee or a predictor of future results. Raymond James and its advisors do not offer tax or legal advice. You should discuss any tax or legal matters with the appropriate professional.

Inflation Hedges Explored

Nicholas Boguth Contributed by: Nicholas Boguth, CFA®

Print Friendly and PDF

Our Director of Investments, Angela Palacios, recently wrote about the factors influencing current inflation rates. She shared a helpful chart from JPMorgan and summarized, “you may be surprised to see the strong average performance from varying asset classes in this scenario. Inflation that is reasonable and expected can be a very positive scenario for many asset classes.”

As the debate continues over whether or not inflation is “transitory,” some investors are thinking about how to protect their portfolios from rising inflation.

Most bonds, aside from TIPS, are generally expected to perform poorly if inflation rises. This should make sense as the fixed income stream from a bond investment will deteriorate if inflation rises. To protect against inflation, one might conclude that removing bonds from a portfolio makes sense, but not so fast. Bonds are typically in a diversified portfolio to protect from the more common (and devastating) risk – a stock market decline. Be sure to know how your portfolio’s risk exposure would shift before considering a move away from bonds.

Vanguard recently released some research on the topic of inflation hedging and concluded that commodities were the best asset class to protect from unexpected inflation. While commodities are generally accepted to be pretty good inflation hedges, one major risk of owning them has been on display for the past ten years. Their return stream can look significantly different than stocks’. Admittedly, this has been one of the best decades in history for U.S. stocks and one of the worst for commodities. To demonstrate just how “different” the returns can be, if you would’ve held one of the largest commodity ETFs over the past ten years, you would’ve underperformed the U.S. stock market by almost 400%.

Trailing 10-year performance of two ETFs that represent the U.S. stock market and the broad commodities market. SPY (green line) tracks the S&P 500, and DBC (blue line) tracks a basket of 14 commodities. Total return. Source: koyfin.com.

Trailing 10-year performance of two ETFs that represent the U.S. stock market and the broad commodities market. SPY (green line) tracks the S&P 500, and DBC (blue line) tracks a basket of 14 commodities. Total return. Source: koyfin.com.

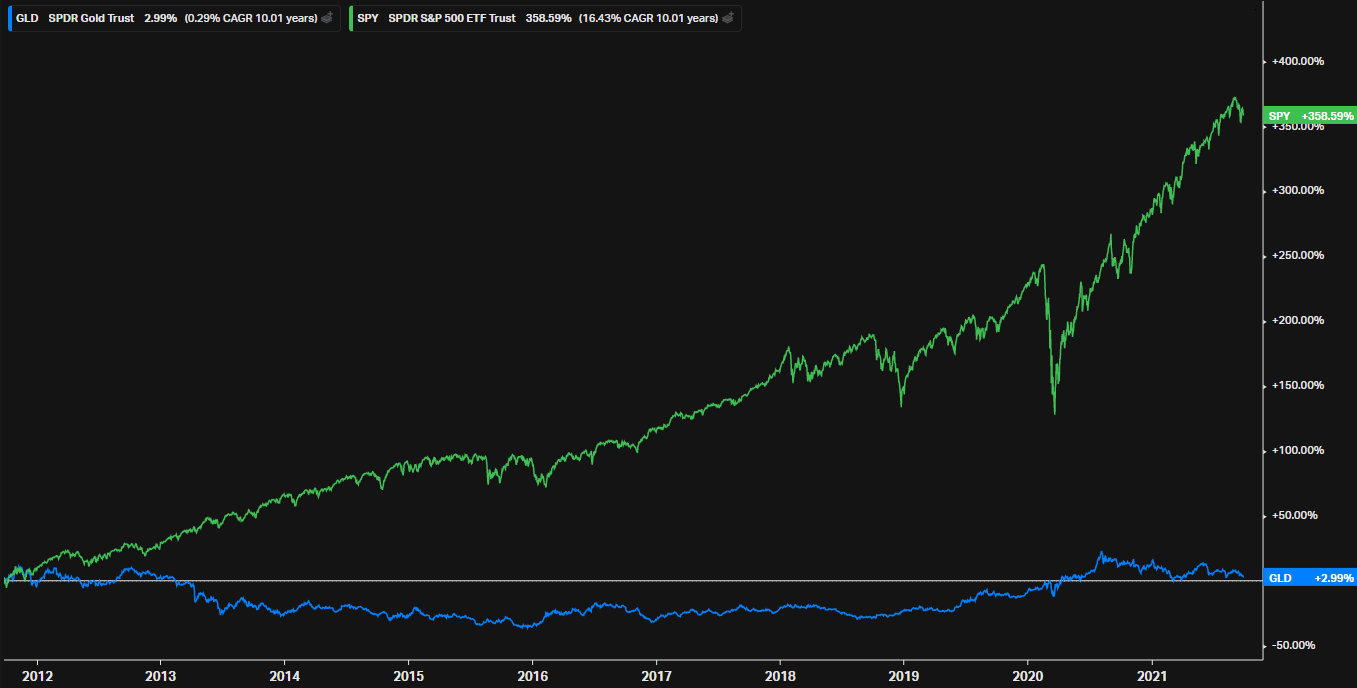
Some portfolio managers like Ray Dalio or First Eagle portfolio managers, Matthew McLennan and Kimball Brooker, have been long time proponents of gold as a hedge against inflation. Gold can be a powerful diversifier in a portfolio, but has also seen sustained periods of underperformance that may make it hard to hold over the long term. Here’s a similar chart of how a popular Gold ETF has performed over the past ten years compared to the red hot S&P 500.

Trailing 10-year performance of two ETFs that represent the U.S. stock market and the price of Gold. SPY (green line) tracks the S&P 500, and GLD (blue line) tracks the gold spot price. Total return. Source: koyfin.com.

Trailing 10-year performance of two ETFs that represent the U.S. stock market and the price of Gold. SPY (green line) tracks the S&P 500, and GLD (blue line) tracks the gold spot price. Total return. Source: koyfin.com.

You may even see articles claiming that bitcoin is the best inflation hedge to add to your portfolio. These opinion pieces make some compelling arguments, but it is important to remember that they are just opinion pieces; emphasis on opinion. We haven’t truly had an inflationary period since bitcoin became popular in the past decade, so there is no way of knowing if its performance has any correlation to U.S. inflation.

Above all else, before jumping to action on your portfolio, remember that inflation is quite hard to forecast. There are an infinite amount of moving parts and multiple ways to measure them. Professional forecasters don’t even agree on what it will look like in the next 12 months, let alone the next ten years or the remainder of your investment time horizon. One of the best ways to hedge against inflation is to talk to your financial advisor and understand how rising inflation might affect your financial plan. That is why we’re here.

Want to know what The Center thinks about inflation? Check out these resources: Inflation and Stock Returns and How Do I Prepare my Portfolio for Inflation.

Nicholas Boguth, CFA® is a Portfolio Administrator at Center for Financial Planning, Inc.® He performs investment research and assists with the management of client portfolios.

Opinions expressed are not necessarily those of Raymond James. The information has been obtained from sources considered to be reliable, but we do not guarantee that the foregoing material is accurate or complete. Past performance is not a guarantee of future results. Investing involves risk and investors may incur a profit or a loss. Treasury Inflation Protection Securities, or TIPS, adjust the invested principal base by the CPI-U at a semiannual rate. Rate of inflation is based on the CPI-U, which has a three-month lag. Bond prices and yields are subject to change based upon market conditions and availability. If bonds are sold prior to maturity, you may receive more or less than your initial investment. There is an inverse relationship between interest rate movements and fixed income prices. Generally, when interest rates rise, fixed income prices fall and when interest rates fall, fixed income prices rise. Investing in commodities is generally considered speculative because of the significant potential for investment loss. Their markets are likely to be volatile and there may be sharp price fluctuations even during periods when prices overall are rising. Gold is subject to the special risks associated with investing in precious metals, including but not limited to: price may be subject to wide fluctuation; the market is relatively limited; the sources are concentrated in countries that have the potential for instability; and the market is unregulated. Bitcoin issuers are not registered with the SEC, and the bitcoin marketplace is currently unregulated. Bitcoin and other cryptocurrencies are a very speculative investment and involves a high degree of risk.

2021 Third Quarter Investment Commentary

The Center Contributed by: Center Investment Department

Print Friendly and PDF

Crisp Air, Cool Breeze, Fall Leaves. All the things that Autumn brings here in Michigan. As the third quarter comes to a close and we enter the last quarter of 2021, we find a cool breeze passing through markets as volatility picks up - as is often the case in September and October. A diversified benchmark portfolio consisting of 60% stocks (split between U.S.-S&P 500 and International-MSCI EAFE) and 40% bonds (Bloomberg Barclays U.S. Aggregate Bond Index) is up just over 7% year-to-date as of September 30th, with the S&P 500 leading the way at +15.9%, international stocks (MSCI EAFE) at +8.35%, and U.S. Aggregate Bonds at -1.55%.

Check out this video to recap some of our thoughts this quarter and continue to read below for some more detailed insight!

Volatility has picked up as the recovery appears to be in a holding pattern. Investors worry about the delta strain and are concerned about a surge in additional strains that could come with the winter flu season. Stock markets don’t have a clear driver of upward returns right now, and we are currently in the middle of two of the most challenging months (September and October) of the year historically for markets. Until September, the S&P 500 hadn’t experienced a 5% decline (which usually occurs 2-4 times per year) since October 2020. The market broke this long streak in late September. Headlines from the government, worry about bonds rates increasing, Chinese real estate headlines, and inflation fears have caused a pause in the steady upside we all had grown quite comfortable to!

It’s important to remember markets frequently experience short-term pullbacks. The below chart shows intra-year stock market declines (red dot and number), as well as the market’s return for the full year (gray bar). This chart shows us that the market is capable of recovering from intra-year drops and still finishing the year in positive territory, which helps us remember to stay the course even when markets get choppy!

Fed Tapering – Will It Cause Volatility?

Google searches on tapering peaked in late August and again in late September surrounding the Federal Reserve (the Fed) meeting. The Fed has fully telegraphed their intention to make this move that, likely, isn’t starting until late this year. It’s important to remember that tapering isn’t tightening. The Fed is lessening the rate they are buying government bonds. Investors wonder, “Will interest rates spike when they stop buying so much?” The answer is maybe. However, there won’t be as much debt being issued next year without fiscal stimulus as has been in the past year and a half. So, current buyers other than the Fed should be able to absorb supply. Also, U.S. Treasury bonds are still paying much more than other government’s bonds that are similar in quality. If rates go up, they will likely be met with headwinds because pension funds and other governments will want that increased yield buying the bonds and thus forcing rates back down again.

Over the summer, the Fed started to unwind the secondary market corporate credit facility that was announced early on in the pandemic to support corporate bonds and fixed income exchange-traded funds. The Fed’s holdings peaked at $14.2 Billion as the move quickly restored stability in markets at the time – March 2020 - and no further action was needed. They are planning the sales in an orderly fashion as not to disrupt markets.

Washington D.C. – A Game of Political Chicken

There have been a lot of headlines toward the end of the third quarter from the government, including government shutdown possibility, reconciliation, infrastructure bill, debt limit increase, and tax increase plans. 

First, the temporary funding bill and debt limit caused short-term volatility as investors were nervous that politicians not seeing eye-to-eye would cause another government shutdown or worse - default on U.S. debt. Fortunately, the President signed a bill funding the government through December 3rd, just hours before the deadline. You may not realize how often we have stood at this precipice before, though. According to the Congressional Research Service and MFS, “There have been 21 government shutdowns in history when our nation’s lawmakers failed to agree on spending bills to fund government outlays for a fiscal year that begins annually on October 1st. The most recent shutdown, a 35-day stoppage that ended on 1/25/19, was the longest closure in history. 11 of the 21 shutdowns lasted three days or less.” Interestingly enough, there are many similarities between now and 2013 when the FED was rolling out their plan for tapering, debt ceiling debate, and government shutdown. While what happened in the past isn’t necessarily what is going to happen now, we believe it offers a helpful perspective. You can see that in 2013 there was an uptick in volatility and a short-term market retreat, but overall the markets continued to move higher through year-end.

Source: Raymond James Chief Investment Officer, Larry Adam

Source: Raymond James Chief Investment Officer, Larry Adam

In September, we gained some clarity on the tax increase proposals to assist in paying for the infrastructure bill. Check out our blog on some of the details, as well as our upcoming webinar! Capital gains tax proposals can potentially disrupt markets in the near term, but the increase in those taxes would go into effect as of mid-September 2021 (retroactively). This is important because it prevents a rush of selling to harvest capital gains before an effective date.

China Headlines

Why has China and emerging markets lagged recently? China is the 2nd biggest economy in the world and the 2nd biggest equity market in the world. China represents 35% of the Emerging Market index, so when China lags, the entire asset class tends to lag too. Active management can be important in this area to navigate the complexities of these varying countries. China has shifted gears recently, choosing to focus on social stability (or “Common prosperity”) rather than pure growth as in the past. China’s Communist Party has turned its eye to the ultra-wealthy, politically outspoken citizens and technology usage.

Most alarmingly, however, has been Evergrande’s debt woes. Evergrande is one of China’s largest real estate developers with a massive amount of debt. They have been forced to sell off assets in order to meet debt repayments, which is having a ripple effect through their customers, suppliers, competitors, and employees. This is so impactful because one-third of China’s Gross Domestic Product is related to real estate. As you can see in the chart below, housing represents over three-quarters of financial assets in China versus a much lower percentage (less than one-third) here in the U.S.

Initially, there was fear of contagion spreading from the Chinese High Yield debt market to the U.S., but this hasn’t occurred.

We remain disciplined in the consistent and proactive execution of our investment process that is anchored in the fundamentals of asset allocation, rebalancing, and patience. From time to time, we may choose to express our forward-looking opinions of the state of stock and bond markets but always strive to do so without subjecting you to unnecessary risks. Even though we close this quarterly note similarly each time, please understand that we thank you for the trust you place in us to guide you through your investment journey!

We have more thoughts to share on investment current events coming soon. Stay tuned for our investment blogs about inflation hedges and Biden’s corporate tax rate proposal.

Angela Palacios, CFP®, AIF®, is a partner and Director of Investments at Center for Financial Planning, Inc.® She chairs The Center Investment Committee and pens a quarterly Investment Commentary.

Any opinions are those of the author and not necessarily those of Raymond James. The information contained in this report does not purport to be a complete description of the securities, markets, or developments referred to in this material. There is no assurance any of the trends mentioned will continue or forecasts will occur. The information has been obtained from sources considered to be reliable, but Raymond James does not guarantee that the foregoing material is accurate or complete. Any information is not a complete summary or statement of all available data necessary for making an investment decision and does not constitute a recommendation. Investing involves risk and you may incur a profit or loss regardless of strategy selected. The S&P 500 is an unmanaged index of 500 widely held stocks that is generally considered representative of the U.S. stock market. The MSCI EAFE (Europe, Australasia, and Far East) is a free float-adjusted market capitalization index that is designed to measure developed market equity performance, excluding the United States & Canada. The EAFE consists of the country indices of 22 developed nations. The Bloomberg Barclays US Aggregate Bond Index is a broad-based flagship benchmark that measures the investment grade, US dollar-denominated, fixed-rate taxable bond market. Keep in mind that individuals cannot invest directly in any index, and index performance does not include transaction costs or other fees, which will affect actual investment performance. Individual investor's results will vary. Past performance does not guarantee future results. Diversification and asset allocation do not ensure a profit or protect against a loss. Dividends are not guaranteed and must be authorized by the company's board of directors. Special Purpose Acquisition Companies may not be suitable for all investors. Investors should be familiar with the unique characteristics, risks and return potential of SPACs, including the risk that the acquisition may not occur or that the customer's investment may decline in value even if the acquisition is completed. Investing involves risk and you may incur a profit or loss regardless of strategy selected. Past performance is not a guarantee or a predictor of future results. Raymond James and its advisors do not offer tax or legal advice. You should discuss any tax or legal matters with the appropriate professional.

Tips for Managing Restricted Stock Units

Robert Ingram Contributed by: Robert Ingram, CFP®

Print Friendly and PDF

Does your employer offer company stock as part of your compensation package? There are many forms of equity compensation ranging from different types of stock awards to employee stock options (ESO) and employee stock purchase plans (ESPP). Over the last several years, Restricted Stocks Units (RSU) have become one of the most popular alternatives offered by companies. 

 Unlike pure stock awards that grant shares of stock or stock options that provide an employee the right to purchase shares at a predetermined price for a specific period of time, grants of RSUs are not actual shares of stock (yet). An RSU is essentially a promise made by the employer company to deliver to the employee shares of stock or cash payment for the value of stock shares following a vesting schedule. The vesting schedule is often based on a required length of employment, such as a three-year or four-year period, or other company performance goals. The number of units generally corresponds to shares of stock, but the units have no value until the employee receives the corresponding stock shares (or equivalent payment) when they vest.  

 How do RSUs Work? 

Let’s say your employer company grants you 1,000 Restricted Stock Units this year with a grant date of September 1st, and a 4-year vesting schedule under which 25% of the units vest each year as shares of the company’s stock. The following September 1st after the original grant date (one year later) as long as you had continued your employment, the first 25% of your 1,000 RSUs vests as actual company stock shares. Assuming the market value of the stock at the time of vesting is $50 per share, you would have 250 shares of stock worth $12,500. 

 Once the shares have vested and been delivered, you now have ownership rights such as voting rights and rights to dividend payments. You can also choose to hold or to sell the shares from that point. In each subsequent year going forward, the next 25% of your RSUs would vest until the 4th year when the remaining 250 of the 1,000 units vest. 

 One of the first important planning considerations for Restricted Stock Units is their taxation. How are RSUs taxed and how might that impact your tax situation?

 There are three triggering events with RSUs to understand.

 When You Receive RSU Grants

In most cases, at the time you receive your RSU grants, there are no tax implications. Because there is no transfer of actual property by the company until vesting in the form of shares or cash payment, the IRS does not consider the value of the stock represented by RSUs as income compensation when the grant occurs. This means the RSU grants themselves are not taxed.

 When RSUs Vest 

 Once the restricted units vest and the employer delivers the shares of stock or equivalent cash payment, the fair market value of the vested shares or cash payment as of that date (minus any amount the employee had to pay for the RSUs) is considered income and is taxed as ordinary income. Typically, companies grant RSUs without the employee paying a portion, so the full value of the vested shares would be reported as income.  

 In our example above with the 1,000 RSU grants, 250 RSUs vested with the fair market value of $50 per share for a total value of $12,500. This $12,500 would be considered compensation and would be reportable as ordinary income for that tax year. This would apply to the remaining RSUs in the years that they vest. Because this amount is treated as ordinary income, the applicable tax rate under the federal income tax brackets would apply (as well as applicable state income taxes).  

 To cover the tax withholding for this reported income at vesting, most companies allow you a few options. These may include:

  • Having the number of shares withheld to cover the equivalent dollar amount

  • Selling shares to provide the proceeds for the withholding amount

  • Providing a cash payment into the plan to cover the withholding

When You Sell Shares 

 At the time RSUs vest, the market value of those shares is reported as ordinary income. That per-share value then becomes the new cost basis for that group of shares. If you immediately sell the vested shares as of the vesting date, there would be no additional tax. The value of the shares has already been taxed as ordinary income, and the sale price of the shares would equal the cost basis of the shares (no additional gain or loss).

 If however, you choose to hold the shares and sell them in the future, any difference between the sale price and the cost basis would be a capital gain or capital loss depending on whether the sale price was greater than or less than the cost basis.  

 Once again using our example of the 1,000 RSU grants, let’s assume the fair market value of 250 shares at vesting was $50 per share and that you held those shares for over one year. If you then sold the 250 shares for $75 per share, you would have a capital gain of $25 per share ($75 - $50) for a total of $6,250. Since you held the shares for more than one year from the vesting date, this $6,250 would be taxed as a long-term capital gain and subject to the long-term capital gains tax rate of either 0%, 15%, or 20% (as of 2021) depending on your total taxable income. 

 If you were to sell shares within one year of their vesting date, any capital gain would be a short-term capital gain taxed as ordinary income. Since the federal tax brackets apply to ordinary income, you may pay a higher tax rate on the short-term capital gain than you would on a long-term gain even at the highest long-term capital gains rate of 20% (depending on where your income falls within the tax brackets).

 Planning for Additional Income

Because Restricted Stock Units can add to your taxable income (as the units vest and potentially when you sell shares), there are some strategies you may consider to help offset the extra taxable income in those years. For individuals and couples in higher tax brackets, this can be an especially important planning item.  

Some examples could include:

  • Maximizing your pre-tax contributions to your 401k, 403(b), or other retirement accounts. If you or your spouse are not yet contributing to the full annual maximum, this can be a great opportunity. ($19,500 in 2021 plus an extra $6,500 “catch up” for age 50 and above). In some cases, if cash flow is tight, it could even make sense to sell a portion of vested RSUs to replace the income going to the extra contributions.

  • Contributions to a Health Savings Account (HSA) are pre-tax/tax-deductible, so each dollar contributed reduces your taxable income. If you have a qualifying high deductible health plan, consider funding an HSA up to the annual maximum ($3,600 for individuals/$,7,200 for family coverage, plus an extra $1,000 “catch up for age 55 and above)

 Deferred Compensation plans (if available) could be an option. Many executive compensation packages offer types of deferred compensation plans. By participating, you generally defer a portion of your income into a plan with the promise that the plan will pay the balance to you in the future. The amount you defer each year does not count towards your income that year. These funds can grow through different investment options, and you select how and when the balance in the plan pays out to you, based on the individual plan rules. While this can be an effective way to reduce current income and build another savings asset, there are many factors to consider before participating. 

  • Plans can be complex, often less flexible than other savings vehicles, and dependent on the financial strength and commitment of the employer.

  • Harvesting capital losses in a regular, taxable investment account can also be a good tax management strategy. By selling investment holdings that have a loss, those capital losses offset realized capital gains. In addition, if there are any remaining excess losses after offsetting gains, you can then offset up to $3,000 of ordinary income per year. Any excess losses above the $3,000 can be carried over to the following tax year.

 When Should I Sell RSUs?

 The factors in the decision to sell or to hold RSUs that have vested as shares (in addition to tax considerations) should be similar to factors you would consider for other individual stocks or investment securities. A question to ask yourself is whether you would choose to invest your own money in the company stock or some other investment. You should consider the fundamentals of the business. Is it a growing business with good prospects within its industry? Is it in a strong financial position; or is it burdened by excessive debt? Consider the valuation of the company. Is the stock price high or low compared to the company’s earnings and cash flow?

Consider what percentage of your investments and net worth the company stock represents. Having too high a concentration of your wealth in a single security poses the risk of significant loss if the stock price falls. Not only are you taking on overall market risk, but you also have the risk of the single company. While each situation is unique, we generally recommend that your percentage of company stock not exceed 10% of your investment assets.

You should also consider your financial needs both short-term and long-term. 

Do you have cash expenses you need to fund in the next year or two and do you already have resources set aside? 

If you’re counting on proceeds from your RSUs, it could make sense to sell shares and protect the cash needed rather than risk selling shares when the value may be lower.  

 As you can see, equity compensation and specifically RSUs can affect different parts of your financial plan and can involve so many variables. That’s why it’s critical that you work with your financial and tax advisors when making these more complex planning decisions. 

So please don’t hesitate to reach out if we can be a resource.

Robert Ingram, CFP®, is a CERTIFIED FINANCIAL PLANNER™ professional at Center for Financial Planning, Inc.® With more than 15 years of industry experience, he is a trusted source for local media outlets and frequent contributor to The Center’s “Money Centered” blog.

Disclosure: While we are familiar with the tax provisions of the issues presented herein, as Financial Advisors of RJFS, we are not qualified to render advice on tax or legal matters. You should discuss tax or legal matters with the appropriate professional.

How To Manage Your Finances After A Divorce

Print Friendly and PDF
0609 KH How to Manage Your Finances After a Divorce.jpg

Divorce isn’t easy.  Determining a settlement, attending court hearings, and dealing with competing attorneys can weigh heavily on all parties involved. In addition to the emotional impact, divorce is logistically complicated.  Paperwork needs to be filed, processed, submitted, and resubmitted.  Assets need to be split, income needs to be protected, and more paperwork needs to be submitted!  With all of these pieces in motion, it can be difficult to truly understand how your financial position will be impacted.  Now, more than ever, you need to be sure that your finances are on the right track.  Although every circumstance is unique, there are few steps that are helpful in most (if not all) situations.

Assess your current financial situation

Following a divorce, you’ll need to get a handle on your budget. You may be responsible for paying expenses that you were once able to share with your former spouse.  What are your current monthly expenses and income?  Regarding expenses, you’ll want to focus on dividing them into two categories: fixed and discretionary.  Fixed expenses include things like housing, food, transportation, taxes, debt payments, and insurance.  Discretionary expenses include things like entertainment and vacations.

Reevaluate your financial goals

Now that your divorce is finalized, you have the opportunity to reflect on your needs and wants separate from anyone else.  If kids are involved, of course their needs will be considered, but now is a time to reprioritize and focus on your needs, too.  Make a list of things you would like to achieve, and allow yourself to think both short and long-term.  Is saving enough to build a cash cushion important to you?  Is retirement savings a focus?  Are you interested in going back to school?  Is investing your settlement funds in a way that reflects your values important to you?

Review your insurance needs

Typically, insurance coverage for one or both spouses is negotiated as part of a divorce settlement, however, there is often still a need to make future adjustments to coverage.  When it comes to health insurance, having adequate coverage is a priority.  You’ll also want to make sure that your disability or life insurance matches your current needs.  Property insurance should also be updated to reflect any property ownership changes resulting from divorce.

Review your beneficiary designations & estate plan

After a divorce, you’ll want to change the beneficiary designations on any life insurance policies, retirement accounts, and bank or credit union accounts. This is also a good time to update or establish your estate plan.

Consider tax implications

Post-divorce your tax filing status will change.  Filing status is determined as of the last day of the year.  So even if your divorce is finalized on December 31st, for tax purposes, you would be considered divorced for that entire year. Be sure to update your payroll withholding as soon as possible.

You may also have new sources of income, deductions, and tax credits could be affected. 

Stay on top of your settlement action items

Splitting assets is no small task, and it is often time consuming.  The sooner you have accounts in your name only, the sooner you will feel a sense of organization and control.  Diligently following up on QDROs, transfers, and rollovers is important to make sure nothing is missed and the process is moving forward as quickly and efficiently as possible.  Working with a financial professional during this process can help to ensure that accounts are moved, invested, and utilized to best fit your needs.

When your current financial picture is clear, it becomes easier to envision your financial future.  Similarly, having a team of financial professionals on your side can create a feeling of security and support, even as you embrace your new found independence.

Kali Hassinger, CFP®, CDFA®, is a CERTIFIED FINANCIAL PLANNER™ professional at Center for Financial Planning, Inc.® She has more than a decade of financial planning and insurance industry experience.


This material is being provided for information purposes only and is not a complete description, nor is it a recommendation. Opinions expressed in the attached article are those of the author and are not necessarily those of Raymond James. All opinions are as of this date and are subject to change without notice. Neither Raymond James Financial Services nor any Raymond James Financial Advisor renders advice on tax issues, these matters should be discussed with the appropriate professional.